đŽ The case for radical solar optimism
No strait, no problem
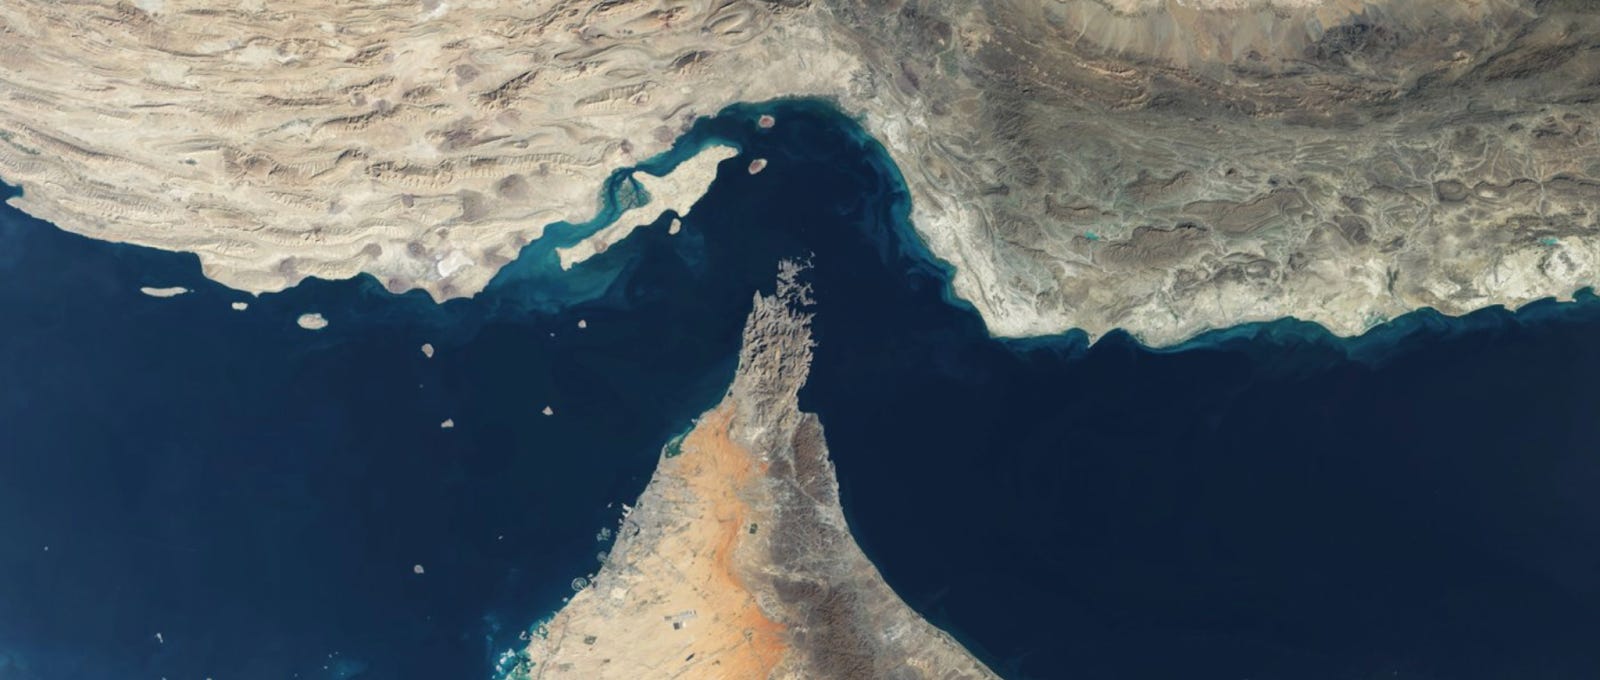
The Strait of Hormuz is just twenty-one miles at its narrowest, shorter than a morning commute in most cities. Through it flows a fifth of the worldâs oil. When it closed last week, it knocked 20 million barrels a day off global supply, roughly the equivalent of the next five biggest oil shocks combined. The price of a barrel crossed $100 in days. That is what a civilization hostage to scarcity looks like.
Electricity grids moved past oil a generation ago. But there are two billion internal combustion engines on the roads that still run on a depletion curve that gives less the more you extract, shaped by geology and chokepoints and cartel politics. The current scale makes it look permanent, but itâs not.
Thatâs because energy now sits on two curves and they move in opposite directions. Oil follows depletion â extract more, get less, pay more. Solar follows learning â make more, get cheaper. Every doubling of cumulative production over the past fifty years has cut the price of solar photovoltaic modules by 23.7%1. Solar panels cost $1,000 per watt in 1958; the cheapest cost seven cents today. The two curves crossed a decade ago but only one of them is still falling. That is the difference between scarcity and abundance â and abundance is winning.
In todayâs essay, we willâŚ
Introduce the solar supercycle, a self-reinforcing loop where every cost reduction opens a new market and every new market funds the next cost reduction.
Show which markets unlock as the price of solar keeps falling, from desalination to green steel and direct carbon capture,
Stressâtest the thesis against the bear case on solar: intermittency, land use, geopolitics, supply chains and the risk that learning rates slow.
Alongside the essay, weâre launching an interactive Wrightâs Law model of the solar supercycle which is based on 50 years of empirical data. The model is available to paying members immediately (access is shared below) and to all readers starting Sunday.
If youâre not a member yet, this is the moment to upgrade and get early access to the solar supercycle model.

Missing the inevitable
For decades, almost everyone with a forecasting model got solar wrong. The IEAâs 2010 models predicted the levelized cost of solar electricity would fall 2.6% per year through 2020. The actual decline was closer to 17%, nearly 7x faster. Policy papers written around 2010 got their timelines wrong by a factor of ten. In 2001, the only institution that predicted anything close to the correct trajectory was Greenpeace in collaboration with the European Photovoltaic Industry Association â and even they undershot. What forecasters got wrong is that they modelled a price. They should have modelled a process.

Solar photovoltaic panels operate on Wrightâs Law: for every doubling of cumulative production, costs fall by a fixed percentage. This is a result of âlearningâ that happens when you make a lot of something â workers get faster, designs are refined, error rates are lower, waste is reduced and more steps get automated. The more youâve made, the cheaper the next unit becomes. That learning rate for solar has held at 23.7% per doubling over the last 48 years,2 confirmed across multiple independent studies.
Fossil fuels cannot do this. They are extracted, not manufactured. Their costs are set by geology, control, demand and supply signals. Production experience helps; new technologies are, of course, more efficient, but they fight the overwhelming gravity of the depletion curve. Of the roughly $16 trillion invested in upstream oil extraction since 1900, half has been invested since 2010. Despite that, oil output has only increased 13%. Depletion curves give you less from more.
Over the past century, coal costs roughly the same in real terms as in the 1880s. Oil has doubled, natural gas has doubled. The only certainty about fossil fuel prices is volatility. All the while, solarâs price curve moves in one direction, down. For the 85% of solar panels made in China, manufacturing capacity now stands at 1,045 GW, almost double the actual production in 2024 of 587 GW.

The supercycle
The process of learning is a flywheel. Again, more production means lower cost. Lower costs increase appeal to customers, which drives more demand. And more demand drives production. At some point, a product tracking Wrightâs Law will see its price fall enough that customers who never thought of buying it start to. A new market opens and the flywheel accelerates.
If that sounds familiar, itâs because youâve lived it. This is the exact flywheel that built the computer industry over the past fifty years. In 1971, Intelâs first microprocessor had 2,300 transistors. Todayâs chips hold 100 billion because a learning curve cut the cost per computation by a factor of 10 billion. That curve did not produce a single product. It produced an industry: mainframes gave way to PCs, PCs to smartphones, smartphones to cloud computing, cloud computing to AI. Each market was unimaginable at the price point of the previous one. Each one funded the next doubling.
Solar photovoltaic is a manufactured technology on a learning curve. It is the energy equivalent of the microprocessor. In fact, early solar borrowed heavily from semiconductor manufacturing technology and materials, including silicon purification know-how and wafer-cutting equipment3. And it has a similar flywheel.
The first solar panels were expensive, $1000 per watt. Only one customer could afford them â NASA. In 1958, Vanguard 1 became the first satellite powered by photovoltaic cells, six small panels generating less than a watt.
The technology was so exotic and expensive that, when the James Bond film The Man with the Golden Gun came out in 1974, its plot revolved around a stolen solar energy device, a technology worth killing for.
But the flywheel was turning. By the late 1970s, panels had fallen to around $76 per watt, cheap enough for Casio to put them on calculators and for off-grid telecom towers in remote locations. This expanded the market, cumulative production doubled and doubled again, and prices came down. By the 1990s, they were affordable enough for rural electrification programs across the developing world.
By 2010, $2 per watt. By 2015, below $0.60, the point at which solar photovoltaic-based systems could reasonably compete on a price basis with fossil fuels for new grid generation. Today: $0.07 per watt. Each threshold opened a market that had not existed at the previous price and each market funded the next collapse.
You can see that the story of solar is not just a story of an energy transition â it is what we call the solar supercycle, the self-reinforcing loop in which every cost reduction opens a new market and every new market funds the next cost reduction, which opens new markets.
The flywheel has been turning for fifty years. Now at a global weighted-average of as low as four cents per kilowatt hour and $0.01-0.02 in optimal locations, solar already cost 56% less than fossil fuel and nuclear alternatives in 2023. It has displaced coal and gas for new power generation in most of the world.
Solar is now large enough to power everything else, and the question we are asking is, what market opens next?
Market creates market
Solar now generates 9.5% of global electricity, from 1% a decade ago. If the market were fixed, if electricity demand stayed where it is, there would be only three-and-a-bit doublings left before solar hit 100%. But the market is not fixed. Every time the price falls far enough, the ceiling moves and a use that was previously uneconomical becomes viable.


