
A month ago, I set out to answer a deceptively simple question: Is AI a bubble?
Since 2024, people have been asking me this as I’ve spoken at events around the world.
Even as Wall Street bankers largely see this as an investment boom, more people are asking the question in meeting rooms and conference halls in Europe and the US.
Some have made up their minds.
called it a “peak bubble.” The Atlantic warns that there is a “possibility that we’re currently experiencing an AI bubble, in which investor excitement has gotten too far ahead of the technology’s near-term productivity benefits. If that bubble bursts, it could put the dot-com crash to shame – and the tech giants and their Silicon Valley backers won’t be the only ones who suffer.” The Economist said that “the potential cost has risen alarmingly high.”The best way to understand a question like this is to create a framework, one that you can update as new evidence emerges. Putting this together has taken dozens of hours of data analysis, modeling and numerous conversations with investors and executives.
This essay is that framework: five gauges to weigh genAI against history’s bubbles.
I studied and lived through the dot-com bubble. I was an investor and felt its effects firsthand.1 Like many of you, I was also active during the Global Financial Crisis. For this reason, I’ve invested considerable thought and analysis into a robust framework to understand what’s going on. I’ll share it with you today.
My thinking is grounded in the study of Carlota Perez, Bill Janeway and other giants in the field, as well as financial analyses of major banks and analysts. But what I haven’t seen anywhere else is a framework that translates those theories into a practical dashboard for AI today: a set of parameters you can read, compare across past bubbles and use to orient your decisions.
We will make the underlying data and methodology available to members of Exponential View in the coming weeks.
I usually reserve my deep dives for paying members of Exponential View. But this question is too important, and the public debate clouded by posturing, for me to keep it behind a paywall. So today’s piece is free for everyone to read. If you want to access this analysis as a PDF, you can download it here.
If you are an investor or executive navigating these questions, I am opening a very limited number of consultation sessions to work directly on them. This is a bespoke opportunity to stress-test your strategy with the same analytical framework I’ve developed. You can apply here.
The meaning of a bubble
Bubbles are among the oldest stories of capitalism. They’re parables of excess, belief and collapse. But bubbles are not just financial phenomena; they are cultural artifacts. They return again and again as morality tales about greed and folly. Tulip mania, often misremembered as a frenzy of bankrupt weavers and drowning merchants, was less disastrous than legend suggests. It was confined to wealthy merchants and left the Dutch economy largely unscathed. But the myth has endured, and that is the point: bubbles become stories we tell ourselves about the dangers of optimism.

Some bubbles are financial: the South Sea frenzy of the 1720s, the roaring stock market of the 1920s, Japan’s real-estate boom in the 1980s and the housing crash of 2008.2 Some are technological. In the 1840s, railways were hailed as the veins of a new industrial body. They were. But a body needs only so many veins, and tracks were soon laid in places commerce could not sustain. Telecoms in the 1990s promised a wired utopia, only for 70 million miles of excess fiber to lie dark underground. The dot-com boom gave us visions of a new economy, much of which did eventually materialize, but not before valuations evaporated in 2000.
The funny thing is that there doesn’t seem to be an academic consensus on what an investment bubble is. Nobel laureate in economics Eugene Fama has gone so far as to say they don’t exist.
I want to go beyond the notion that we know a bubble when we see a bubble. There are two interrelated systems at work. The first, the most visible, is when stock markets become absurdly overvalued and collapse. The second is whether the quantity of productive capital (going into capital expenditure or venture capital) deployed collapses. The two are related, of course. A collapse in equity prices makes investment flows more expensive. And a secular decline in productive capital investment may be read by equity markets as a harbinger of a slowdown.
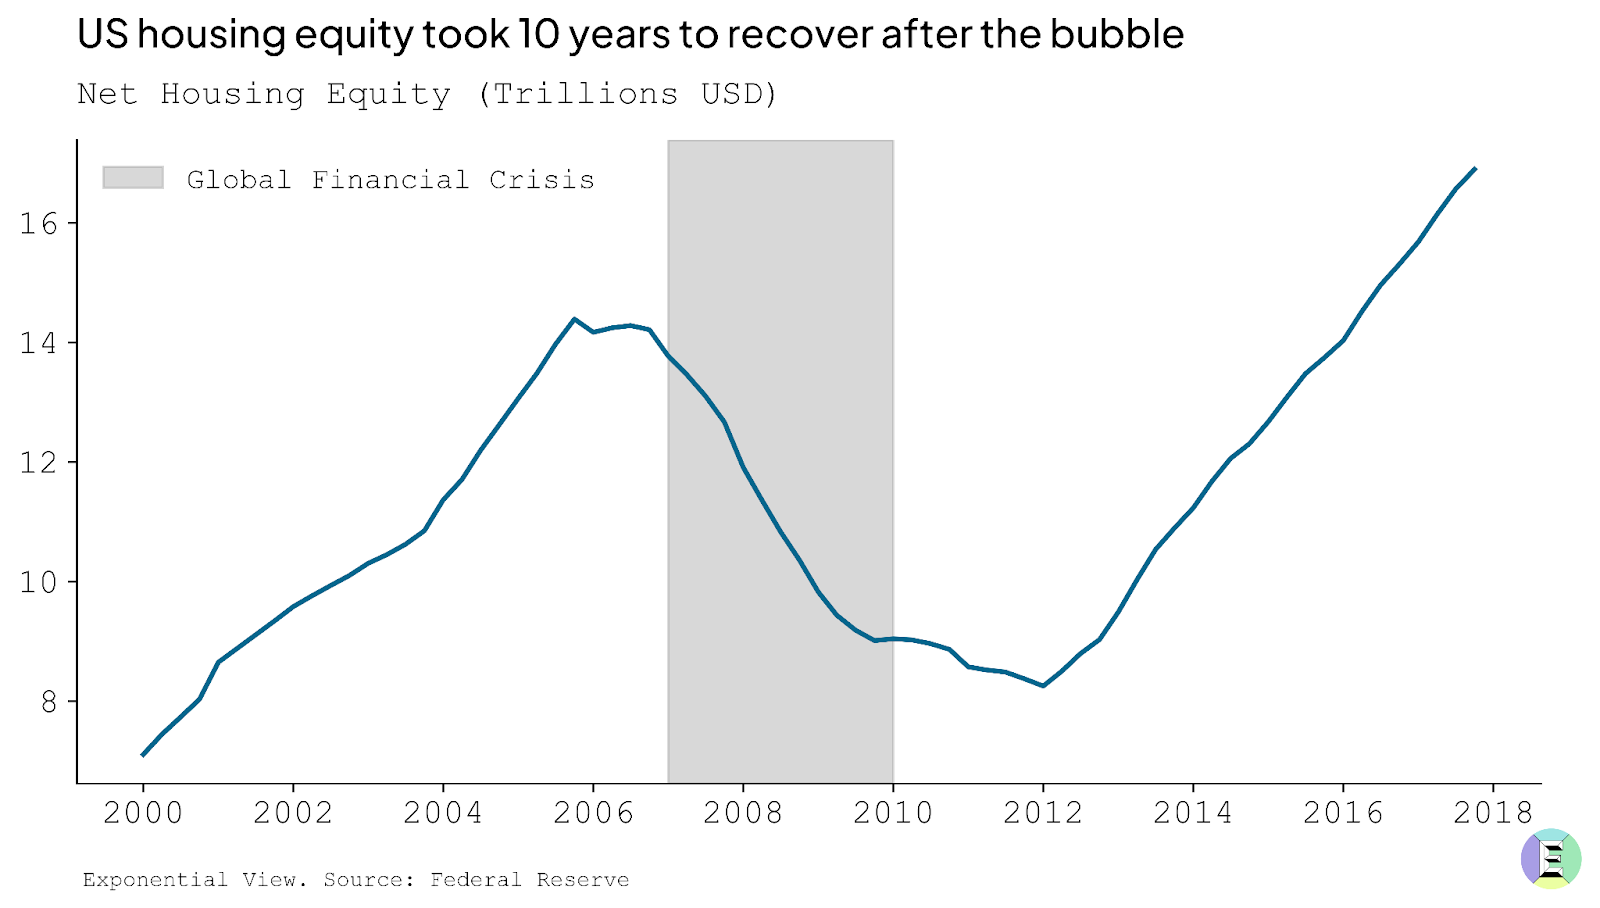
But to frame this: we see a bubble as being a 50% drawdown from the peak equity value that is sustained for at least five years. In the case of the US housing bubble and the dot-com, that trough was roughly five years long. Full recovery to pre-bubble peaks took 10 years for US housing, and 15 for the dot-com. Alongside, we would expect a substantial decline in the rate of productive capital deployed, once again 50% from peak.
For the purposes of this analysis, by “bubble” I’ll address both of those competing dimensions. Ultimately, it means a phase marked by a rapid escalation in prices and investment, where valuations drift materially away from the underlying prospects and realistic earnings power of the assets involved. Bubbles thrive on abundant capital and seductive narratives, and they tend to end in a sharp and sustained reversal that wipes out much of the paper wealth created on the way up.
A “boom,” by contrast, can look very similar in its early stages with rising valuations and accelerating investment. But the crucial distinction is that, in a boom, fundamentals eventually catch up. The underlying cash flows, productivity gains, or genuine demand growth rise to meet the optimism. Booms can still overshoot, but they consolidate into durable industries and lasting economic value.
Between the two lies a gray zone: periods of exuberance when it is genuinely hard to tell whether capital is building the foundations of a new economy or merely inflating prices that will not be sustained. It’s like being in the eye of a storm: you can feel the wind, rain and pressure, but you don’t yet know whether it will clear the air or flatten the house.
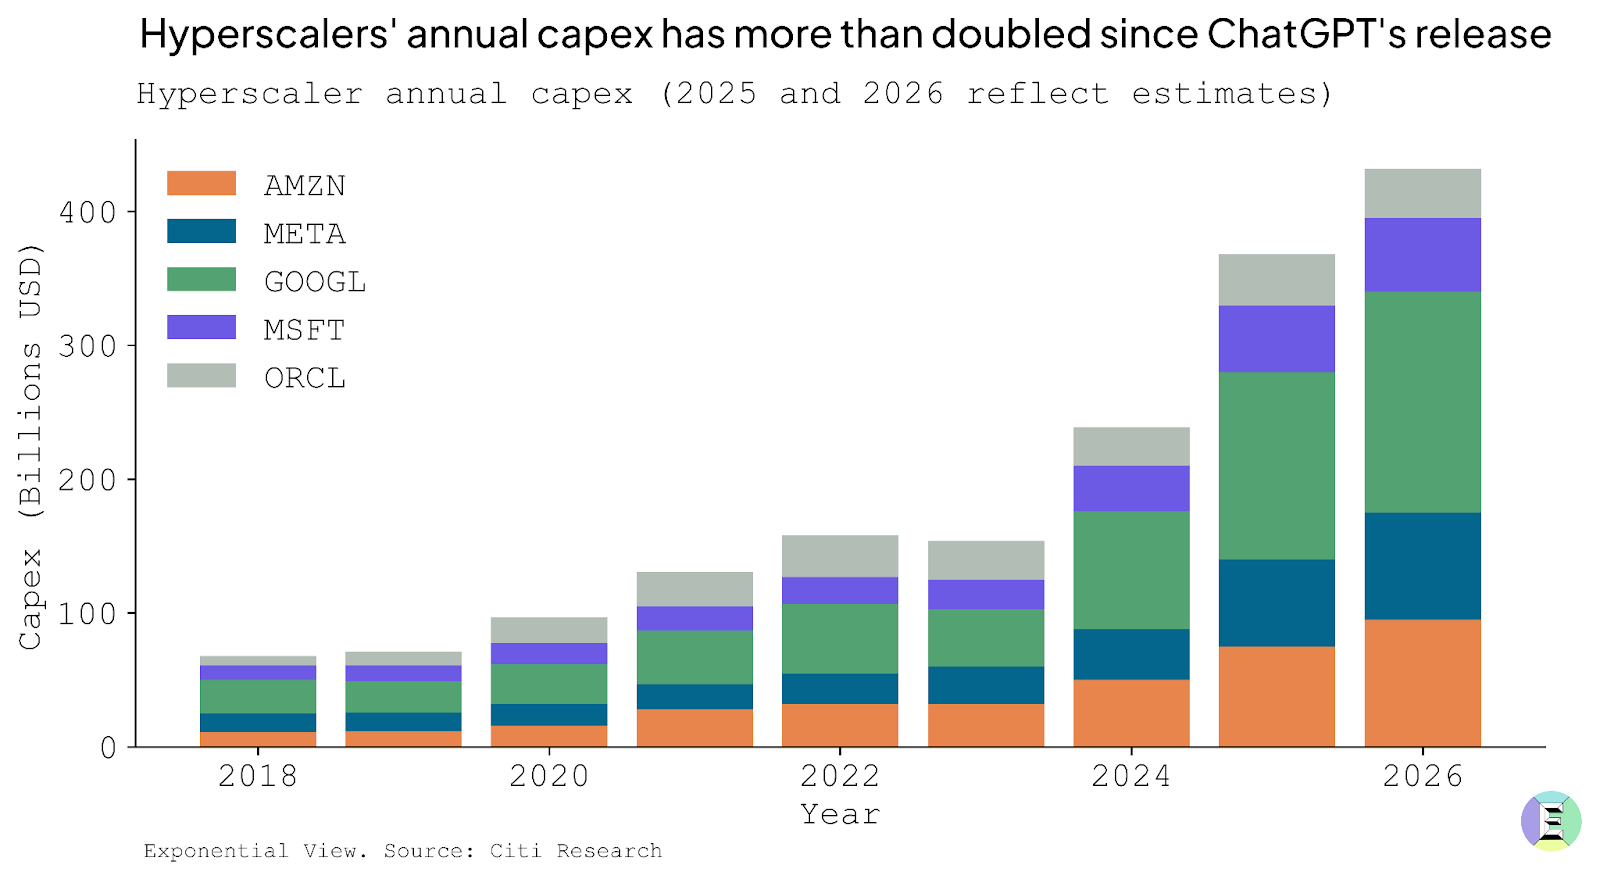
This brings us to the present question: is AI another bubble? What unsettles many observers are the numbers. Since ChatGPT’s release in late 2022, hyperscalers have more than doubled their annual data center capex, betting heavily on the infrastructure needed to train and run ever-larger models. When Sam Altman floated a $7 trillion investment requirement last year, it sounded like hubris. Today, investors aren’t laughing; they’re wondering whether the scale of spending is sustainable.
Bubbles are impossible to diagnose in real time. Only in retrospect do we know whether exuberance was justified or delusional. Rather than making a definitive call — which borders on unhelpful speculation — it’s better to benchmark today’s boom against history to spot where bubble-like dynamics may be creeping in.
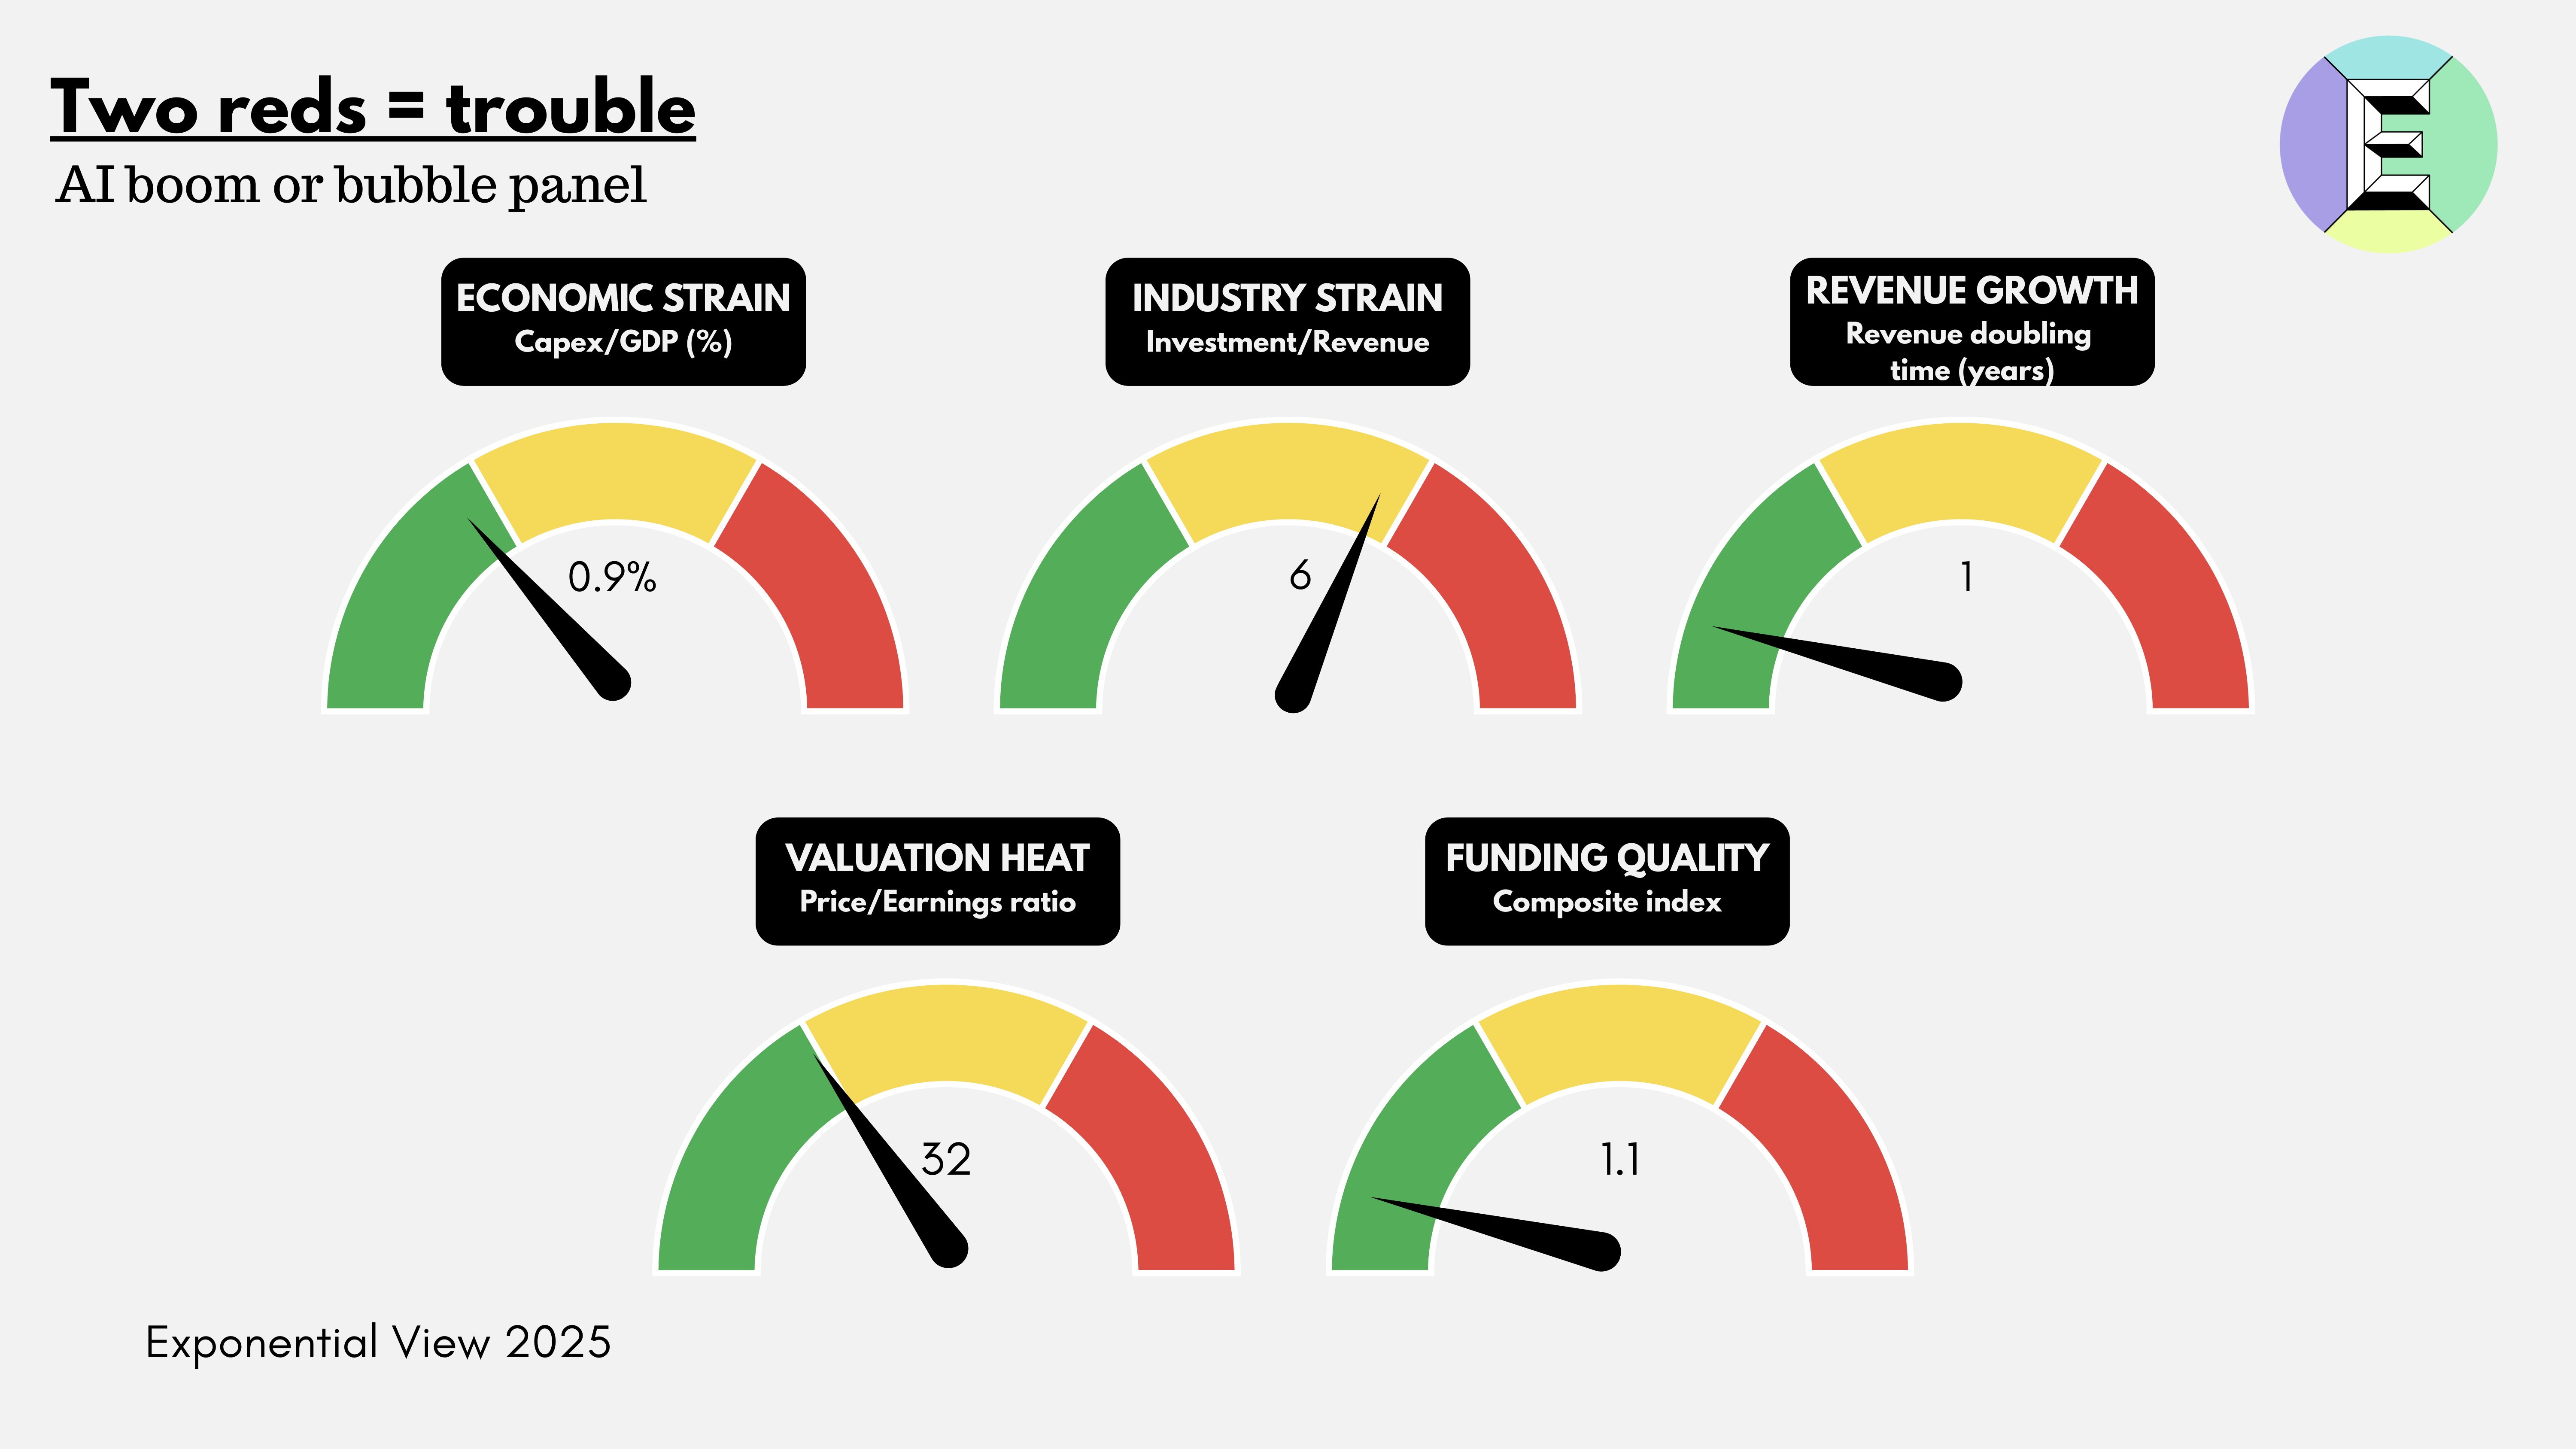
We’re thinking of this as flying a plane. Pilots don’t rely on a single instrument. They monitor a cluster of gauges to understand how the flight is going. We’ll use five of them here:
Gauge 1 – Economic strain: Is investment now large enough to bend the economy?
Gauge 2 – Industry strain: Are industry revenues commensurate with the deployed capex?
Gauge 3 – Revenue growth: Is revenue rising/broadening fast enough to catch up?
Gauge 4 – Valuation heat: How hot are valuations? Compared to history, are stocks excessively overpriced?
Gauge 5 – Funding quality: What kind of money is funding this? Is it strong balance sheets, or fragile, flighty capital?
In the rest of the essay, I look at each gauge to explain why it may be green, amber or red, and at the end I pull them together into a full dashboard view.
Gauge 1: Economic strain
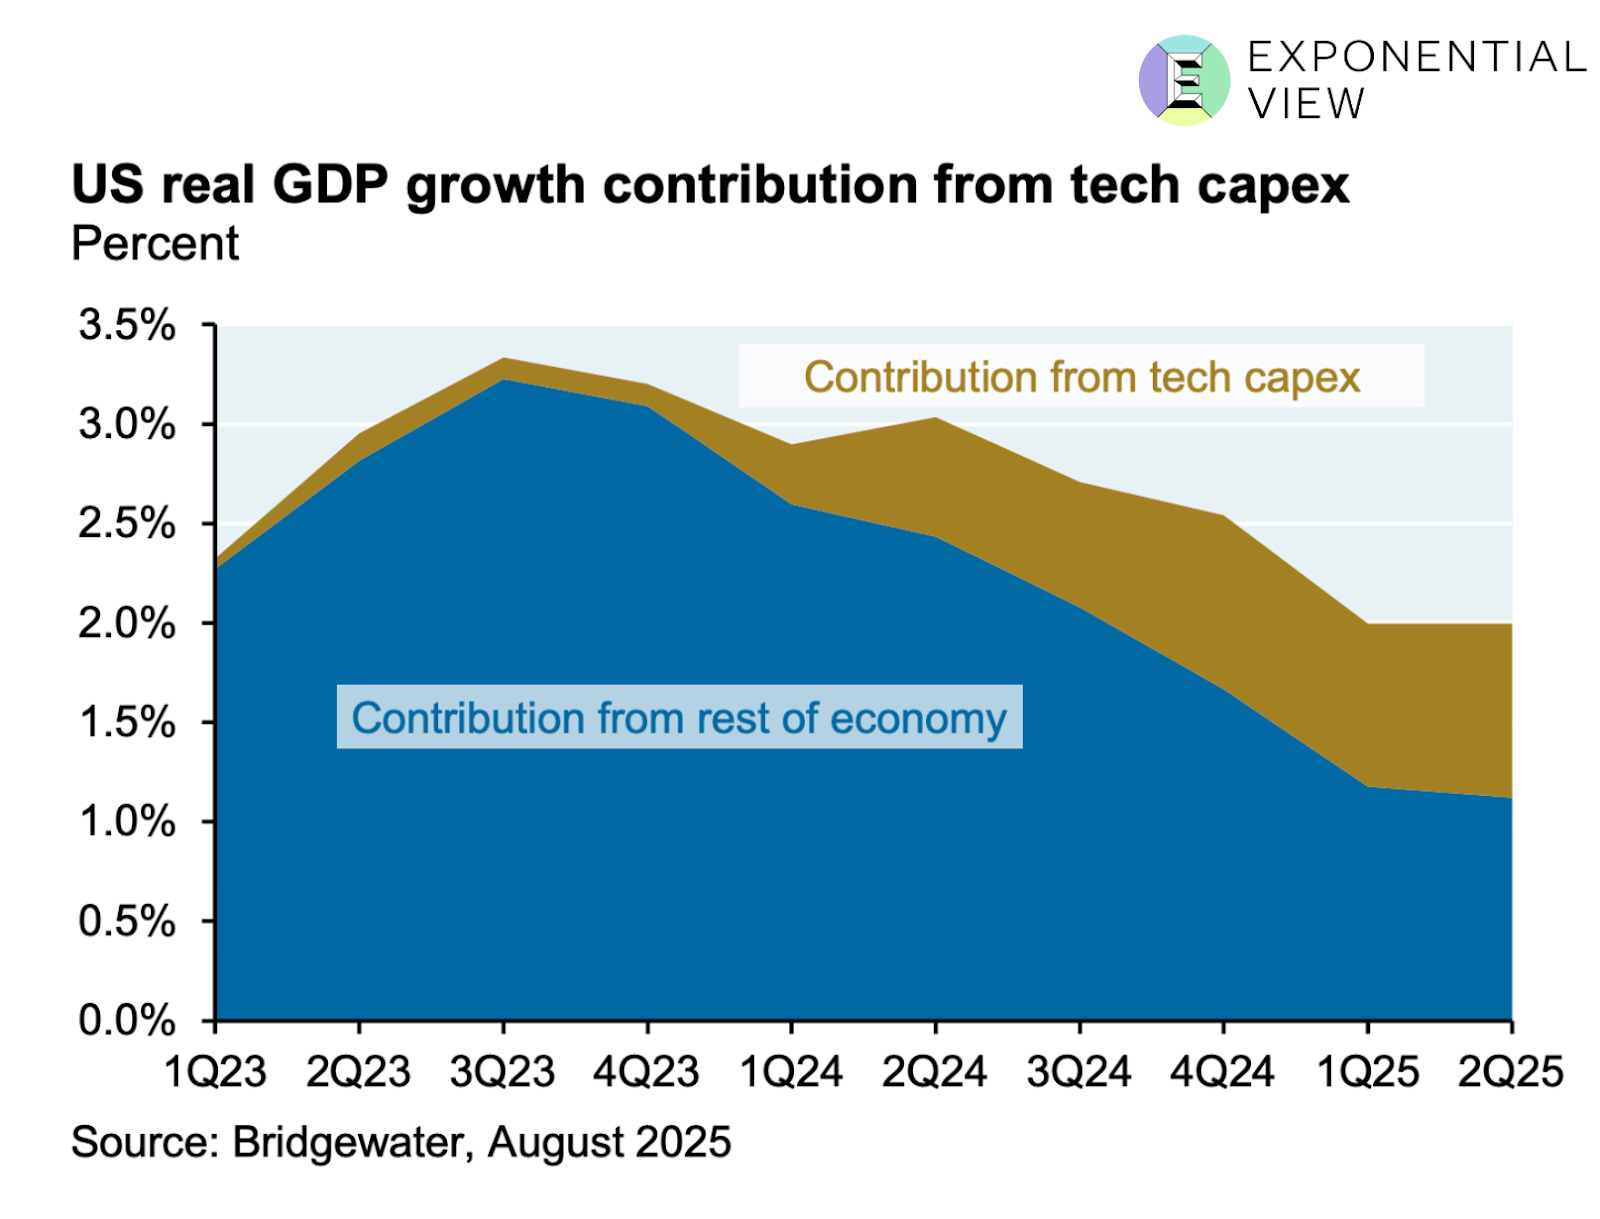
The investment underway is vast, with Morgan Stanley expecting $3 trillion in AI infrastructure spend by 2029. But it has not yet reached the runaway extremes of history’s great blowouts. What makes this dimension tricky is dependence. In the US, more than a third of GDP growth can be traced to data center construction.
This is not inherently bad, but it may be dangerous if the momentum falters. An economy leaning this heavily on one sector for growth can find the ground falling away faster than expected.
The surge of capital expenditure (capex), poured into the physical infrastructure that AI demands, is an act of optimism. This is what capex is. Money spent today in the belief that it will become a funnel of revenue tomorrow. If it’s well-placed today, it will eventually lead to productivity gains and economic expansion.
If you want to sell people hula hoops to promote their health and happiness, you need to buy hula hoops first. And somewhere down the line, there needs to be a factory making them. Funding that factory is capex. You deploy the capex to build a useful thing that you can sell. Capex investment is often, but not always, a precursor to a growing business.
AI data centers have a similar quality, and something more. They are not just factories for a single product; they are infrastructure. Microsoft, OpenAI and the US government all see it this way. They see compute as a foundational utility of the 21st century, no less critical than highways, railways, power grids or telecom networks were in earlier eras. I made the same argument in my last book, so you can guess where I stand. Excluding the US, sovereign governments have made more than $1 trillion in commitments to AI as infrastructure by 2030.
To build such infrastructure inevitably requires historic sums, on a par with the railway and electricity build-outs of the past. McKinsey projects that meeting AI-driven demand by 2030 will require around 156 GW of new electrical capacity — the size of Spain’s and Portugal’s grids combined. The firm estimates this will cost $5-7.9 trillion in capital spending. For context, this is about twenty times the cost of the Apollo missions. This would place AI data centers among the largest infrastructure build-outs in modern history.
But useful though infrastructure is, especially when private capital gets involved, things can get divorced from reality. The financing structure matters as much as the technology itself. The railways in the US were largely privately funded and suffered from multiple investment bubbles. Electricity and road systems, by contrast, benefited from greater public investment and coordination, and were less prone to speculative excess. A boom becomes dangerous when the resources it demands start to bend the whole economy around it. Wages get sucked into one sector, supply chains reorient to serve it and capital markets grow dependent on it. The snapback is vicious when expectations break.
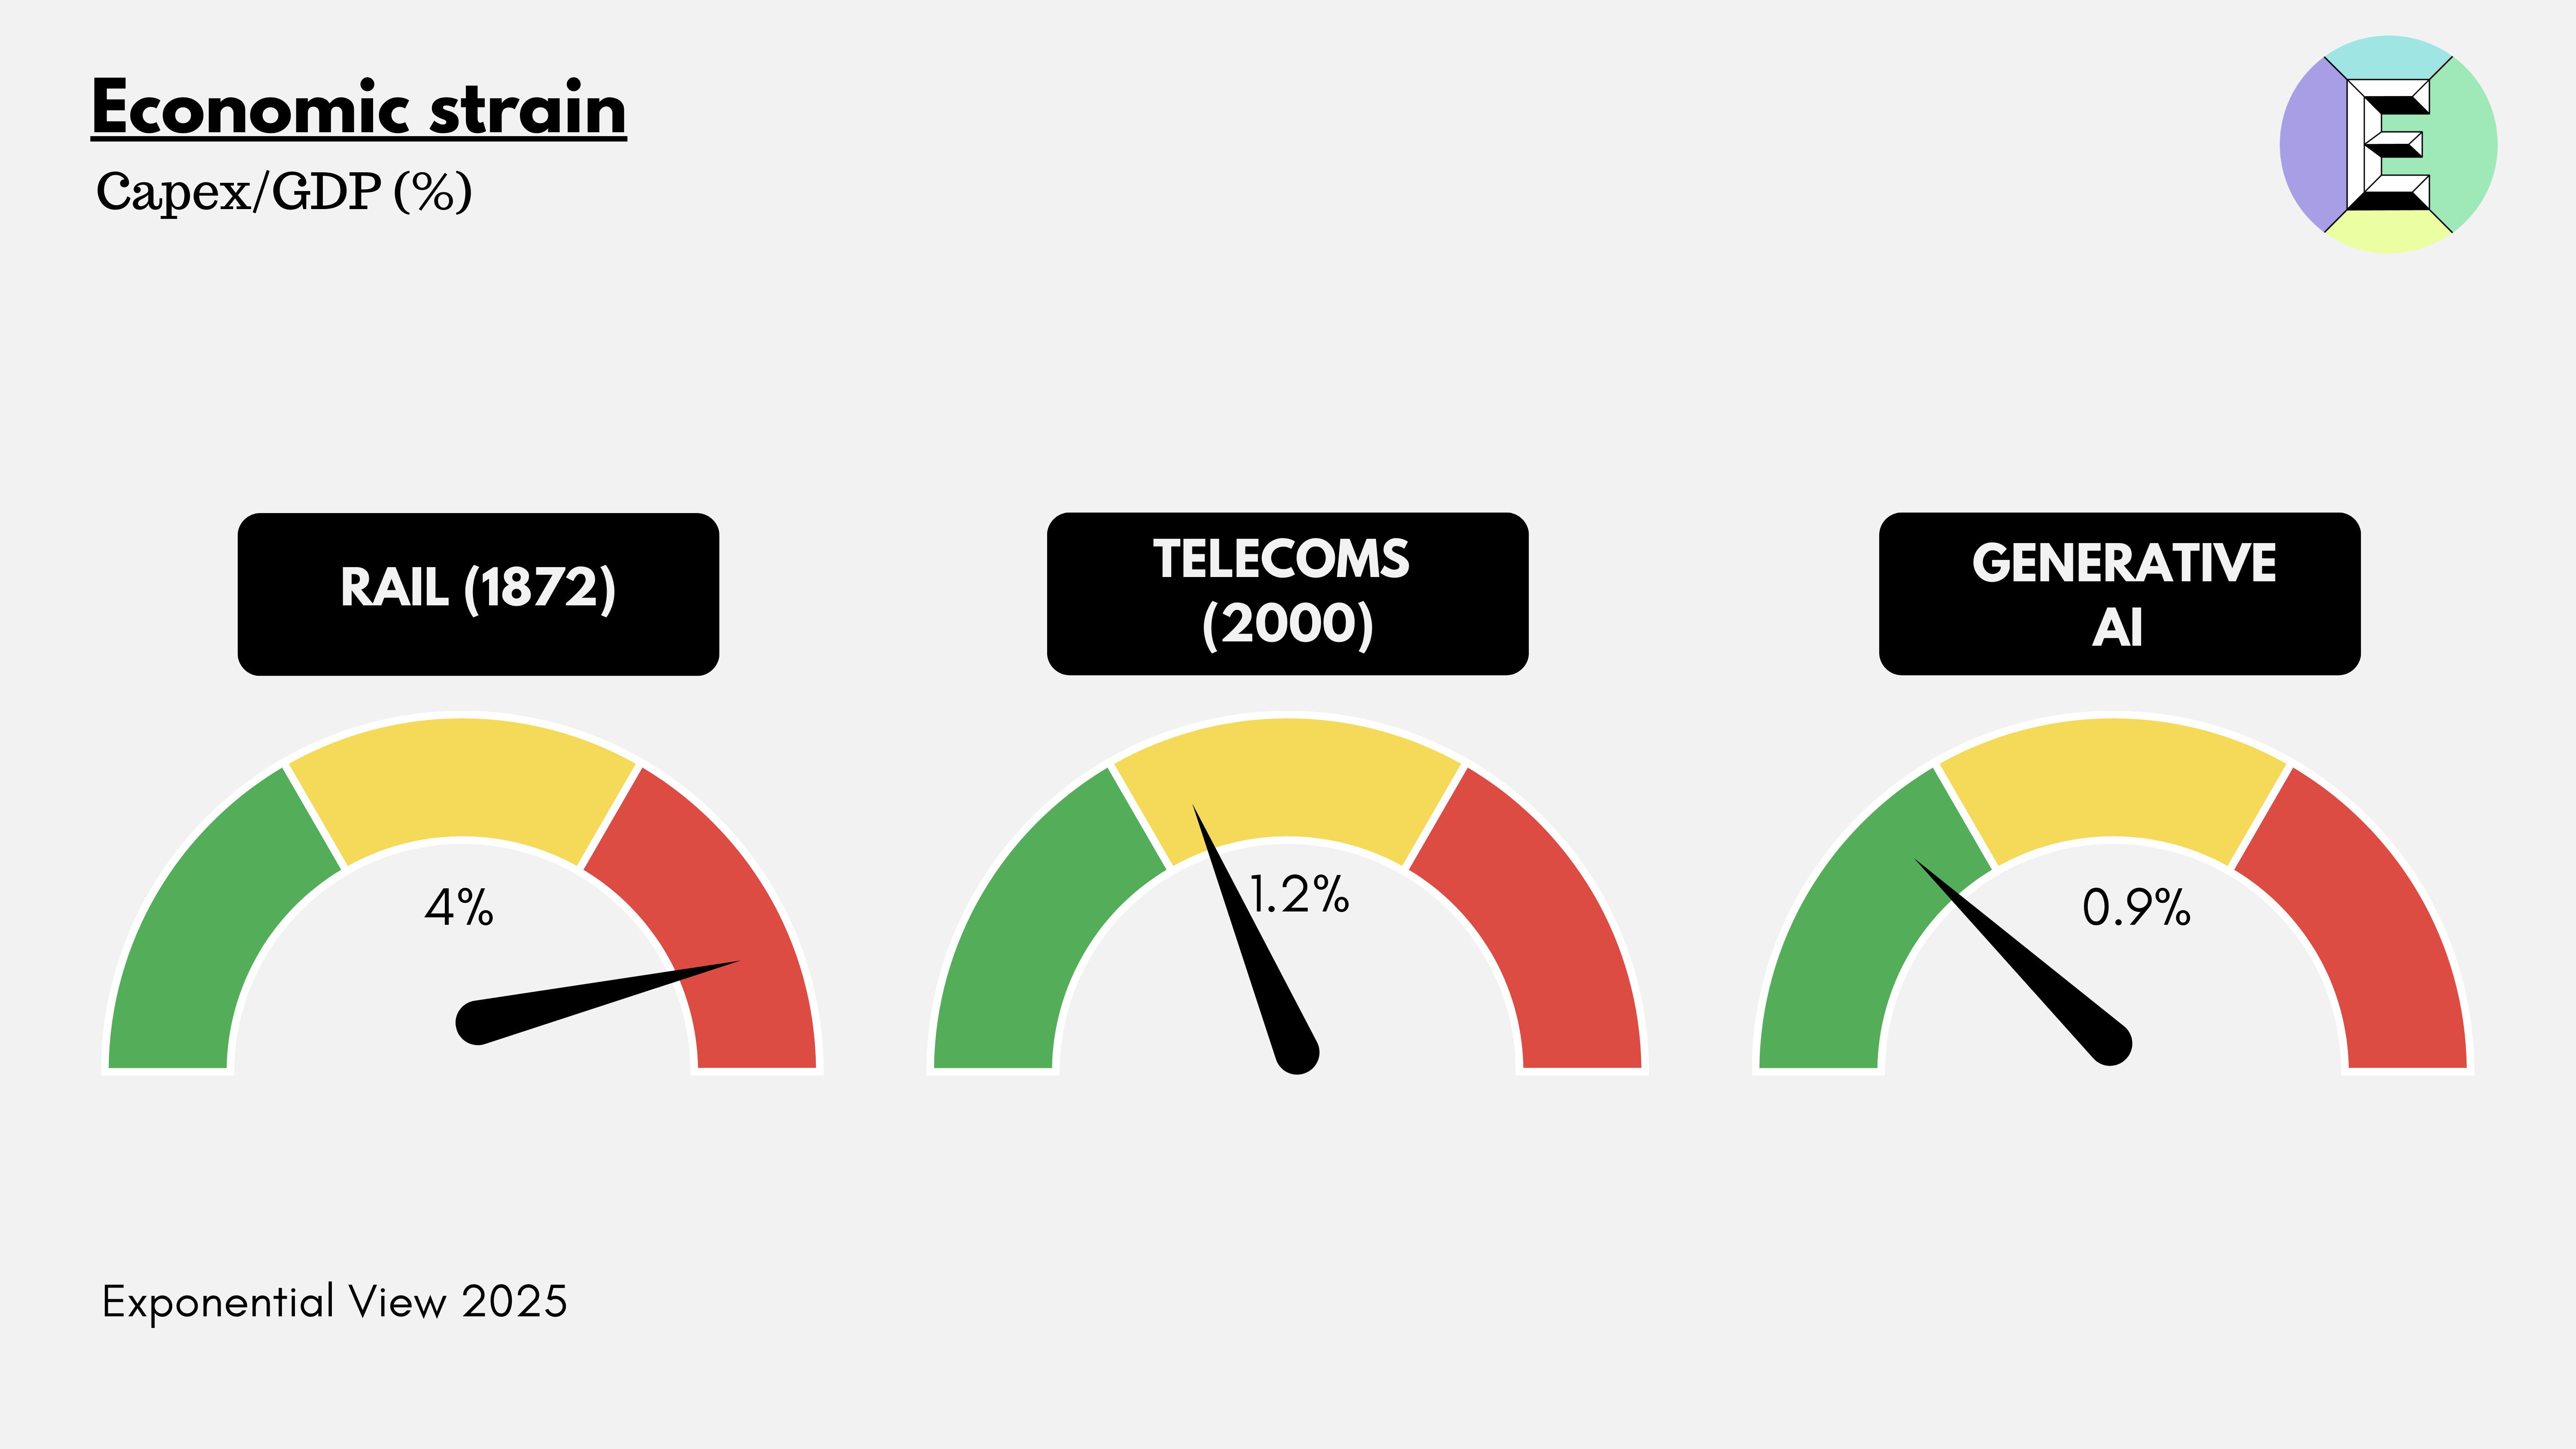
One way to gauge the economic strain is to look at investment as a share of GDP, the portion of national output funneled into a single technological frontier. It is a crude but telling ratio. It shows how heavily the economy leans on one technological bet.
In the case of AI infrastructure, most of that spending takes the form of capital expenditures: the servers, cooling systems, networking gear, shells of concrete and steel and the power infrastructure required to keep them running.
By that measure, the railway bubbles were the heaviest. In the United States, railway spending peaked at around 4% of GDP in 1872, just before the first great crash. The telecom boom of the late 1990s, by contrast, topped out near 1% of GDP, a level that looks familiar today.
The AI build-out sits in this middle zone. Around $370 billion is expected to flow into data centers globally in 2025, with perhaps 70% earmarked for the US,3 or roughly 0.9% of American GDP. Goldman Sachs projects spending will climb by another 17% in 2026. My own forecasts are in line with this view: annual capex of $800 billion by 2030, perhaps 60% in the US, which would bring the American share to 1.6% of 2025 GDP.
The economic-strain gauge has three segments: green up to 1%, amber up to 2% and red above 2%. So today, genAI sits in the green zone – just. Of course, given stated commitments, it looks like it’ll head into amber soon.
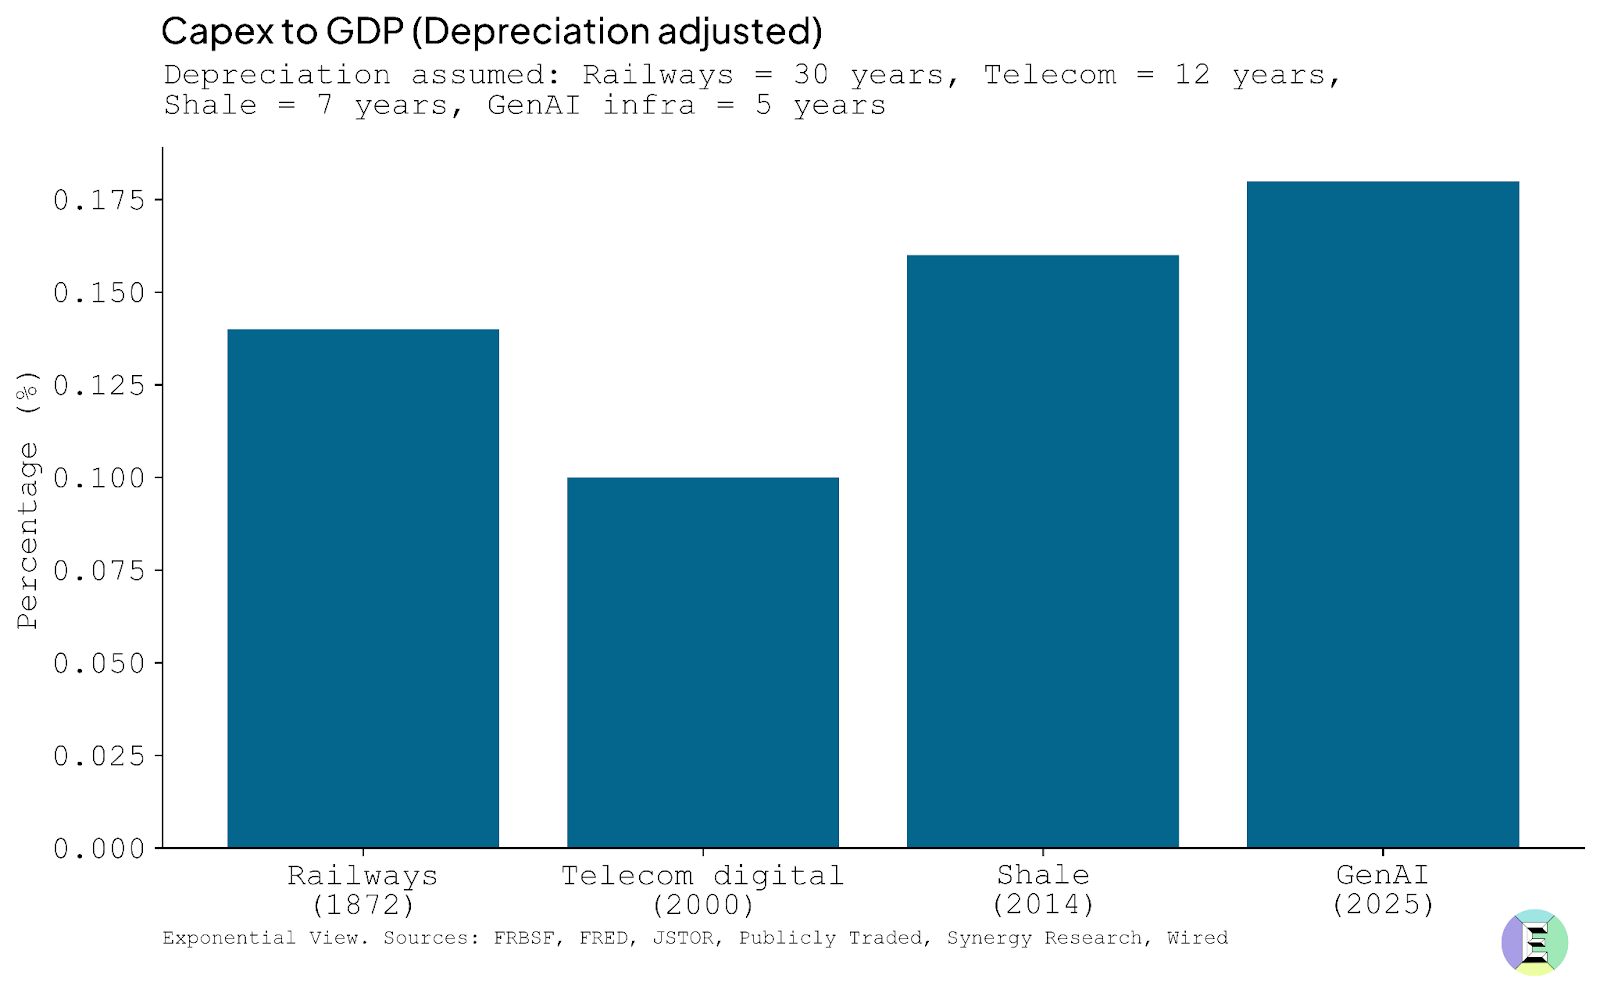
But there is a twist here that history’s bubbles did not face: rapid depreciation. Once laid, a railway track could last decades. The US was still running freight over 19th-century tracks well into the 20th. Telecom fiber rolled out in the 1990s still carries traffic 35 years later.
GPUs, by contrast, age in dog years. Their useful life for frontier applications such as model training is perhaps three years, after which they are relegated to lower-intensity tasks. Roughly a third of hyperscaler capex is going into such short-lived assets. They remain, in theory, monetizable in years five and six. The rest goes into shells, power and cooling that last two or three decades. Adjusting for asset life makes the AI build-out look even more demanding: unlike railroads or fiber, the system must earn its keep in a handful of years, not generations.
Whether this dynamic makes financial conditions worse or better is an open question. The pessimistic view is that a box of ripe bananas is worth less than the same value of Brazil nuts, because it must be consumed quickly. But the optimistic case is intriguing: shorter depreciation cycles may impose financial discipline on incoming investors. During the railway mania, decades-long asset lives masked the weakness of many business models; companies could stagger on for years before insolvency. In AI, the flaws may surface quickly, forcing either rapid adaptation or rapid failure.
The strain is noticeable but not yet unbearable. Venture funding at the AI application layer, while noisy, remains modest compared with the telecom mania of the 1990s.4 That suggests there may still be running room before the cycle overheats. The trillions pouring into servers, cooling systems and power lines may be essential, but history suggests they are not where the enduring profits accumulate. In railways, many track companies went bust, but the logistics firms and commodity barons riding their lines prospered. In telecoms, it was not the builders of fiber who captured the upside but the platforms and service providers that used the bandwidth. The same logic may apply to AI: hyperscalers shoulder the capex burden, but the durable value may accrue to those who control the models, the data and the ecosystems built on top.
This brings us to the second gauge on the dashboard: industry strain.
Gauge 2: Industry strain
Every boom needs to prove that the money poured into new equipment is starting to earn its keep. In any growth stage, it is unlikely that revenues will cover investment, but they should be non-zero. This gauge looks at the ratio of capex to revenues.