
A month ago, I set out to answer a deceptively simple question: Is AI a bubble?
Since 2024, people have been asking me this as I’ve spoken at events around the world.
Even as Wall Street bankers largely see this as an investment boom, more people are asking the question in meeting rooms and conference halls in Europe and the US.
Some have made up their minds.
called it a “peak bubble.” The Atlantic warns that there is a “possibility that we’re currently experiencing an AI bubble, in which investor excitement has gotten too far ahead of the technology’s near-term productivity benefits. If that bubble bursts, it could put the dot-com crash to shame – and the tech giants and their Silicon Valley backers won’t be the only ones who suffer.” The Economist said that “the potential cost has risen alarmingly high.”The best way to understand a question like this is to create a framework, one that you can update as new evidence emerges. Putting this together has taken dozens of hours of data analysis, modeling and numerous conversations with investors and executives.
This essay is that framework: five gauges to weigh genAI against history’s bubbles.
I studied and lived through the dot-com bubble. I was an investor and felt its effects firsthand.1 Like many of you, I was also active during the Global Financial Crisis. For this reason, I’ve invested considerable thought and analysis into a robust framework to understand what’s going on. I’ll share it with you today.
My thinking is grounded in the study of Carlota Perez, Bill Janeway and other giants in the field, as well as financial analyses of major banks and analysts. But what I haven’t seen anywhere else is a framework that translates those theories into a practical dashboard for AI today: a set of parameters you can read, compare across past bubbles and use to orient your decisions.

We will make the underlying data and methodology available to members of Exponential View in the coming weeks.
I usually reserve my deep dives for paying members of Exponential View. But this question is too important, and the public debate clouded by posturing, for me to keep it behind a paywall. So today’s piece is free for everyone to read. If you want to access this analysis as a PDF, you can download it here.
If you are an investor or executive navigating these questions, I am opening a very limited number of consultation sessions to work directly on them. This is a bespoke opportunity to stress-test your strategy with the same analytical framework I’ve developed. You can apply here.
The meaning of a bubble
Bubbles are among the oldest stories of capitalism. They’re parables of excess, belief and collapse. But bubbles are not just financial phenomena; they are cultural artifacts. They return again and again as morality tales about greed and folly. Tulip mania, often misremembered as a frenzy of bankrupt weavers and drowning merchants, was less disastrous than legend suggests. It was confined to wealthy merchants and left the Dutch economy largely unscathed. But the myth has endured, and that is the point: bubbles become stories we tell ourselves about the dangers of optimism.

Some bubbles are financial: the South Sea frenzy of the 1720s, the roaring stock market of the 1920s, Japan’s real-estate boom in the 1980s and the housing crash of 2008.2 Some are technological. In the 1840s, railways were hailed as the veins of a new industrial body. They were. But a body needs only so many veins, and tracks were soon laid in places commerce could not sustain. Telecoms in the 1990s promised a wired utopia, only for 70 million miles of excess fiber to lie dark underground. The dot-com boom gave us visions of a new economy, much of which did eventually materialize, but not before valuations evaporated in 2000.
The funny thing is that there doesn’t seem to be an academic consensus on what an investment bubble is. Nobel laureate in economics Eugene Fama has gone so far as to say they don’t exist.
I want to go beyond the notion that we know a bubble when we see a bubble. There are two interrelated systems at work. The first, the most visible, is when stock markets become absurdly overvalued and collapse. The second is whether the quantity of productive capital (going into capital expenditure or venture capital) deployed collapses. The two are related, of course. A collapse in equity prices makes investment flows more expensive. And a secular decline in productive capital investment may be read by equity markets as a harbinger of a slowdown.
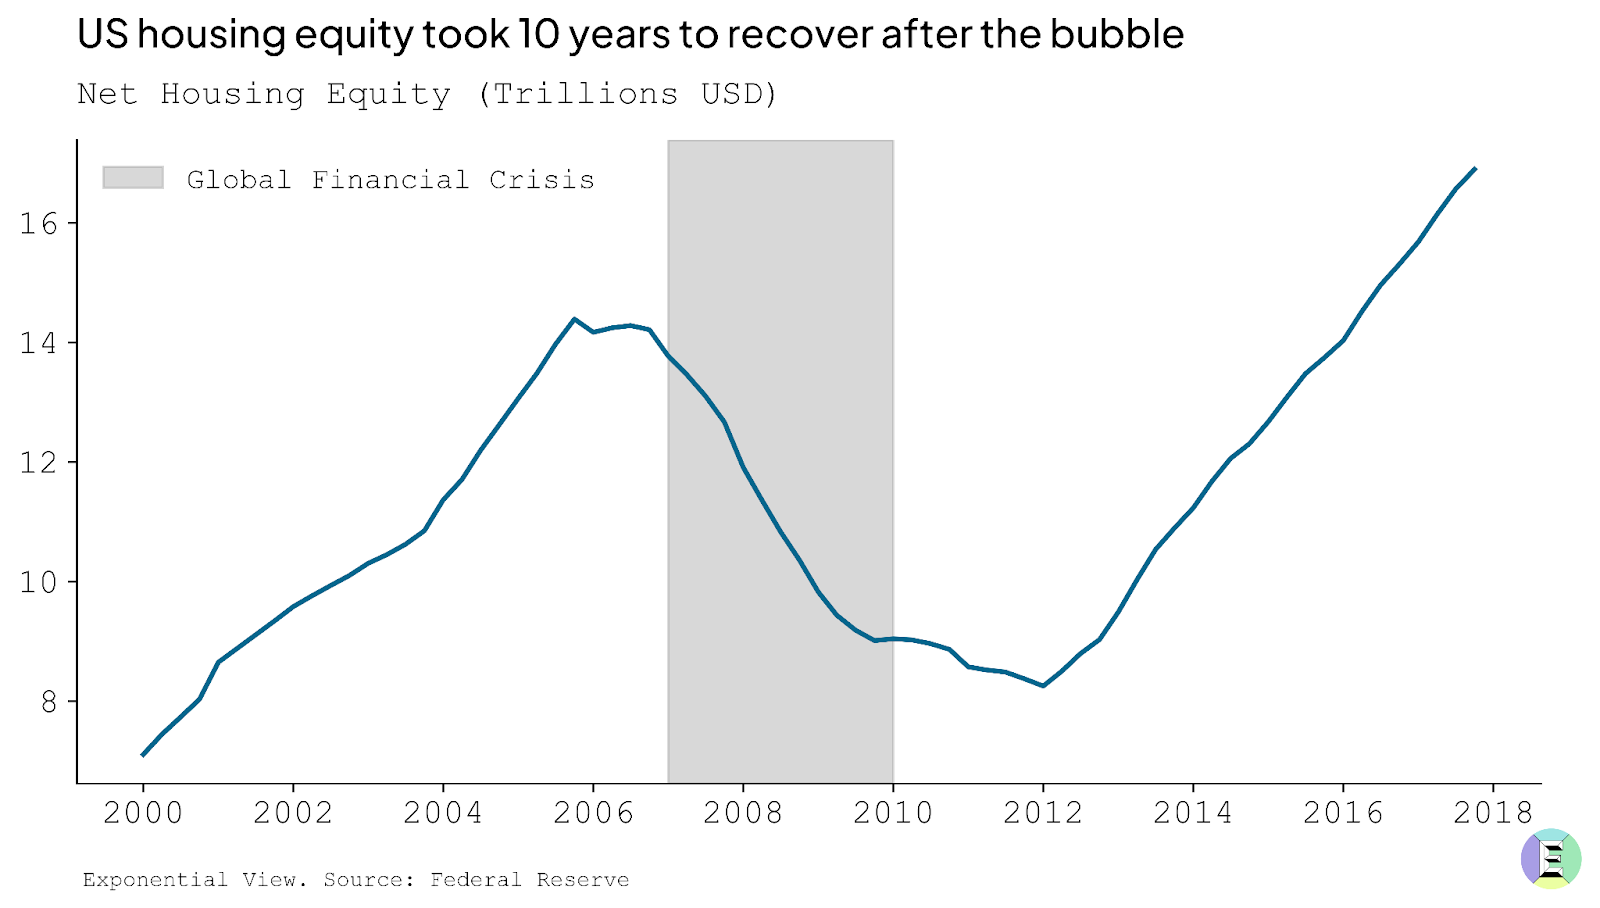
But to frame this: we see a bubble as being a 50% drawdown from the peak equity value that is sustained for at least five years. In the case of the US housing bubble and the dot-com, that trough was roughly five years long. Full recovery to pre-bubble peaks took 10 years for US housing, and 15 for the dot-com. Alongside, we would expect a substantial decline in the rate of productive capital deployed, once again 50% from peak.
For the purposes of this analysis, by “bubble” I’ll address both of those competing dimensions. Ultimately, it means a phase marked by a rapid escalation in prices and investment, where valuations drift materially away from the underlying prospects and realistic earnings power of the assets involved. Bubbles thrive on abundant capital and seductive narratives, and they tend to end in a sharp and sustained reversal that wipes out much of the paper wealth created on the way up.
A “boom,” by contrast, can look very similar in its early stages with rising valuations and accelerating investment. But the crucial distinction is that, in a boom, fundamentals eventually catch up. The underlying cash flows, productivity gains, or genuine demand growth rise to meet the optimism. Booms can still overshoot, but they consolidate into durable industries and lasting economic value.
Between the two lies a gray zone: periods of exuberance when it is genuinely hard to tell whether capital is building the foundations of a new economy or merely inflating prices that will not be sustained. It’s like being in the eye of a storm: you can feel the wind, rain and pressure, but you don’t yet know whether it will clear the air or flatten the house.
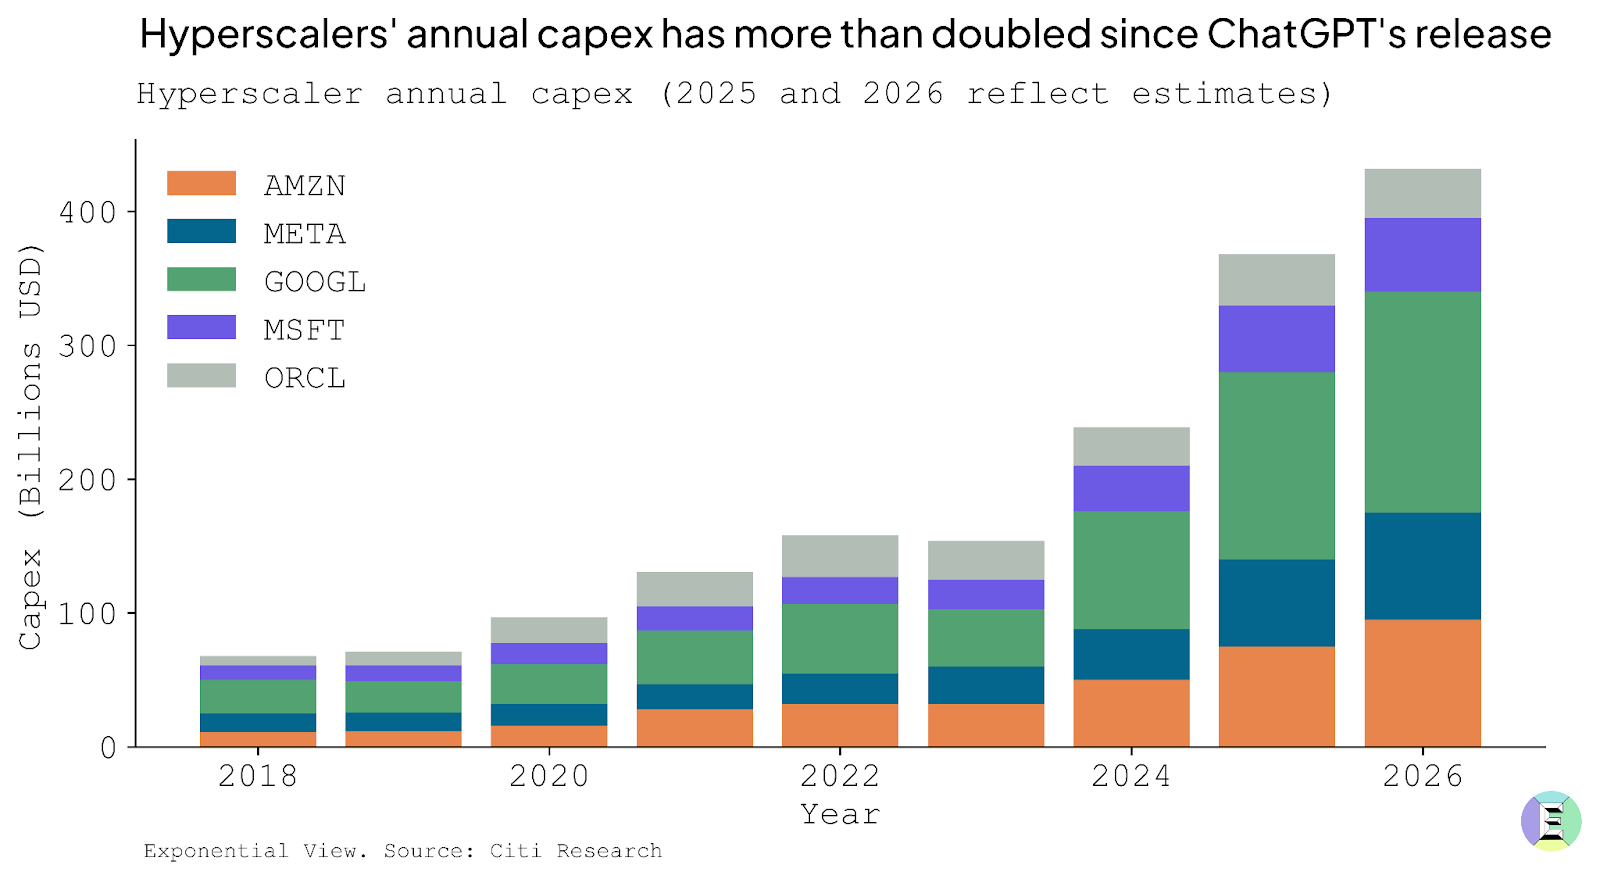
This brings us to the present question: is AI another bubble? What unsettles many observers are the numbers. Since ChatGPT’s release in late 2022, hyperscalers have more than doubled their annual data center capex, betting heavily on the infrastructure needed to train and run ever-larger models. When Sam Altman floated a $7 trillion investment requirement last year, it sounded like hubris. Today, investors aren’t laughing; they’re wondering whether the scale of spending is sustainable.
Bubbles are impossible to diagnose in real time. Only in retrospect do we know whether exuberance was justified or delusional. Rather than making a definitive call — which borders on unhelpful speculation — it’s better to benchmark today’s boom against history to spot where bubble-like dynamics may be creeping in.
We’re thinking of this as flying a plane. Pilots don’t rely on a single instrument. They monitor a cluster of gauges to understand how the flight is going. We’ll use five of them here:
Gauge 1 – Economic strain: Is investment now large enough to bend the economy?
Gauge 2 – Industry strain: Are industry revenues commensurate with the deployed capex?
Gauge 3 – Revenue growth: Is revenue rising/broadening fast enough to catch up?
Gauge 4 – Valuation heat: How hot are valuations? Compared to history, are stocks excessively overpriced?
Gauge 5 – Funding quality: What kind of money is funding this? Is it strong balance sheets, or fragile, flighty capital?
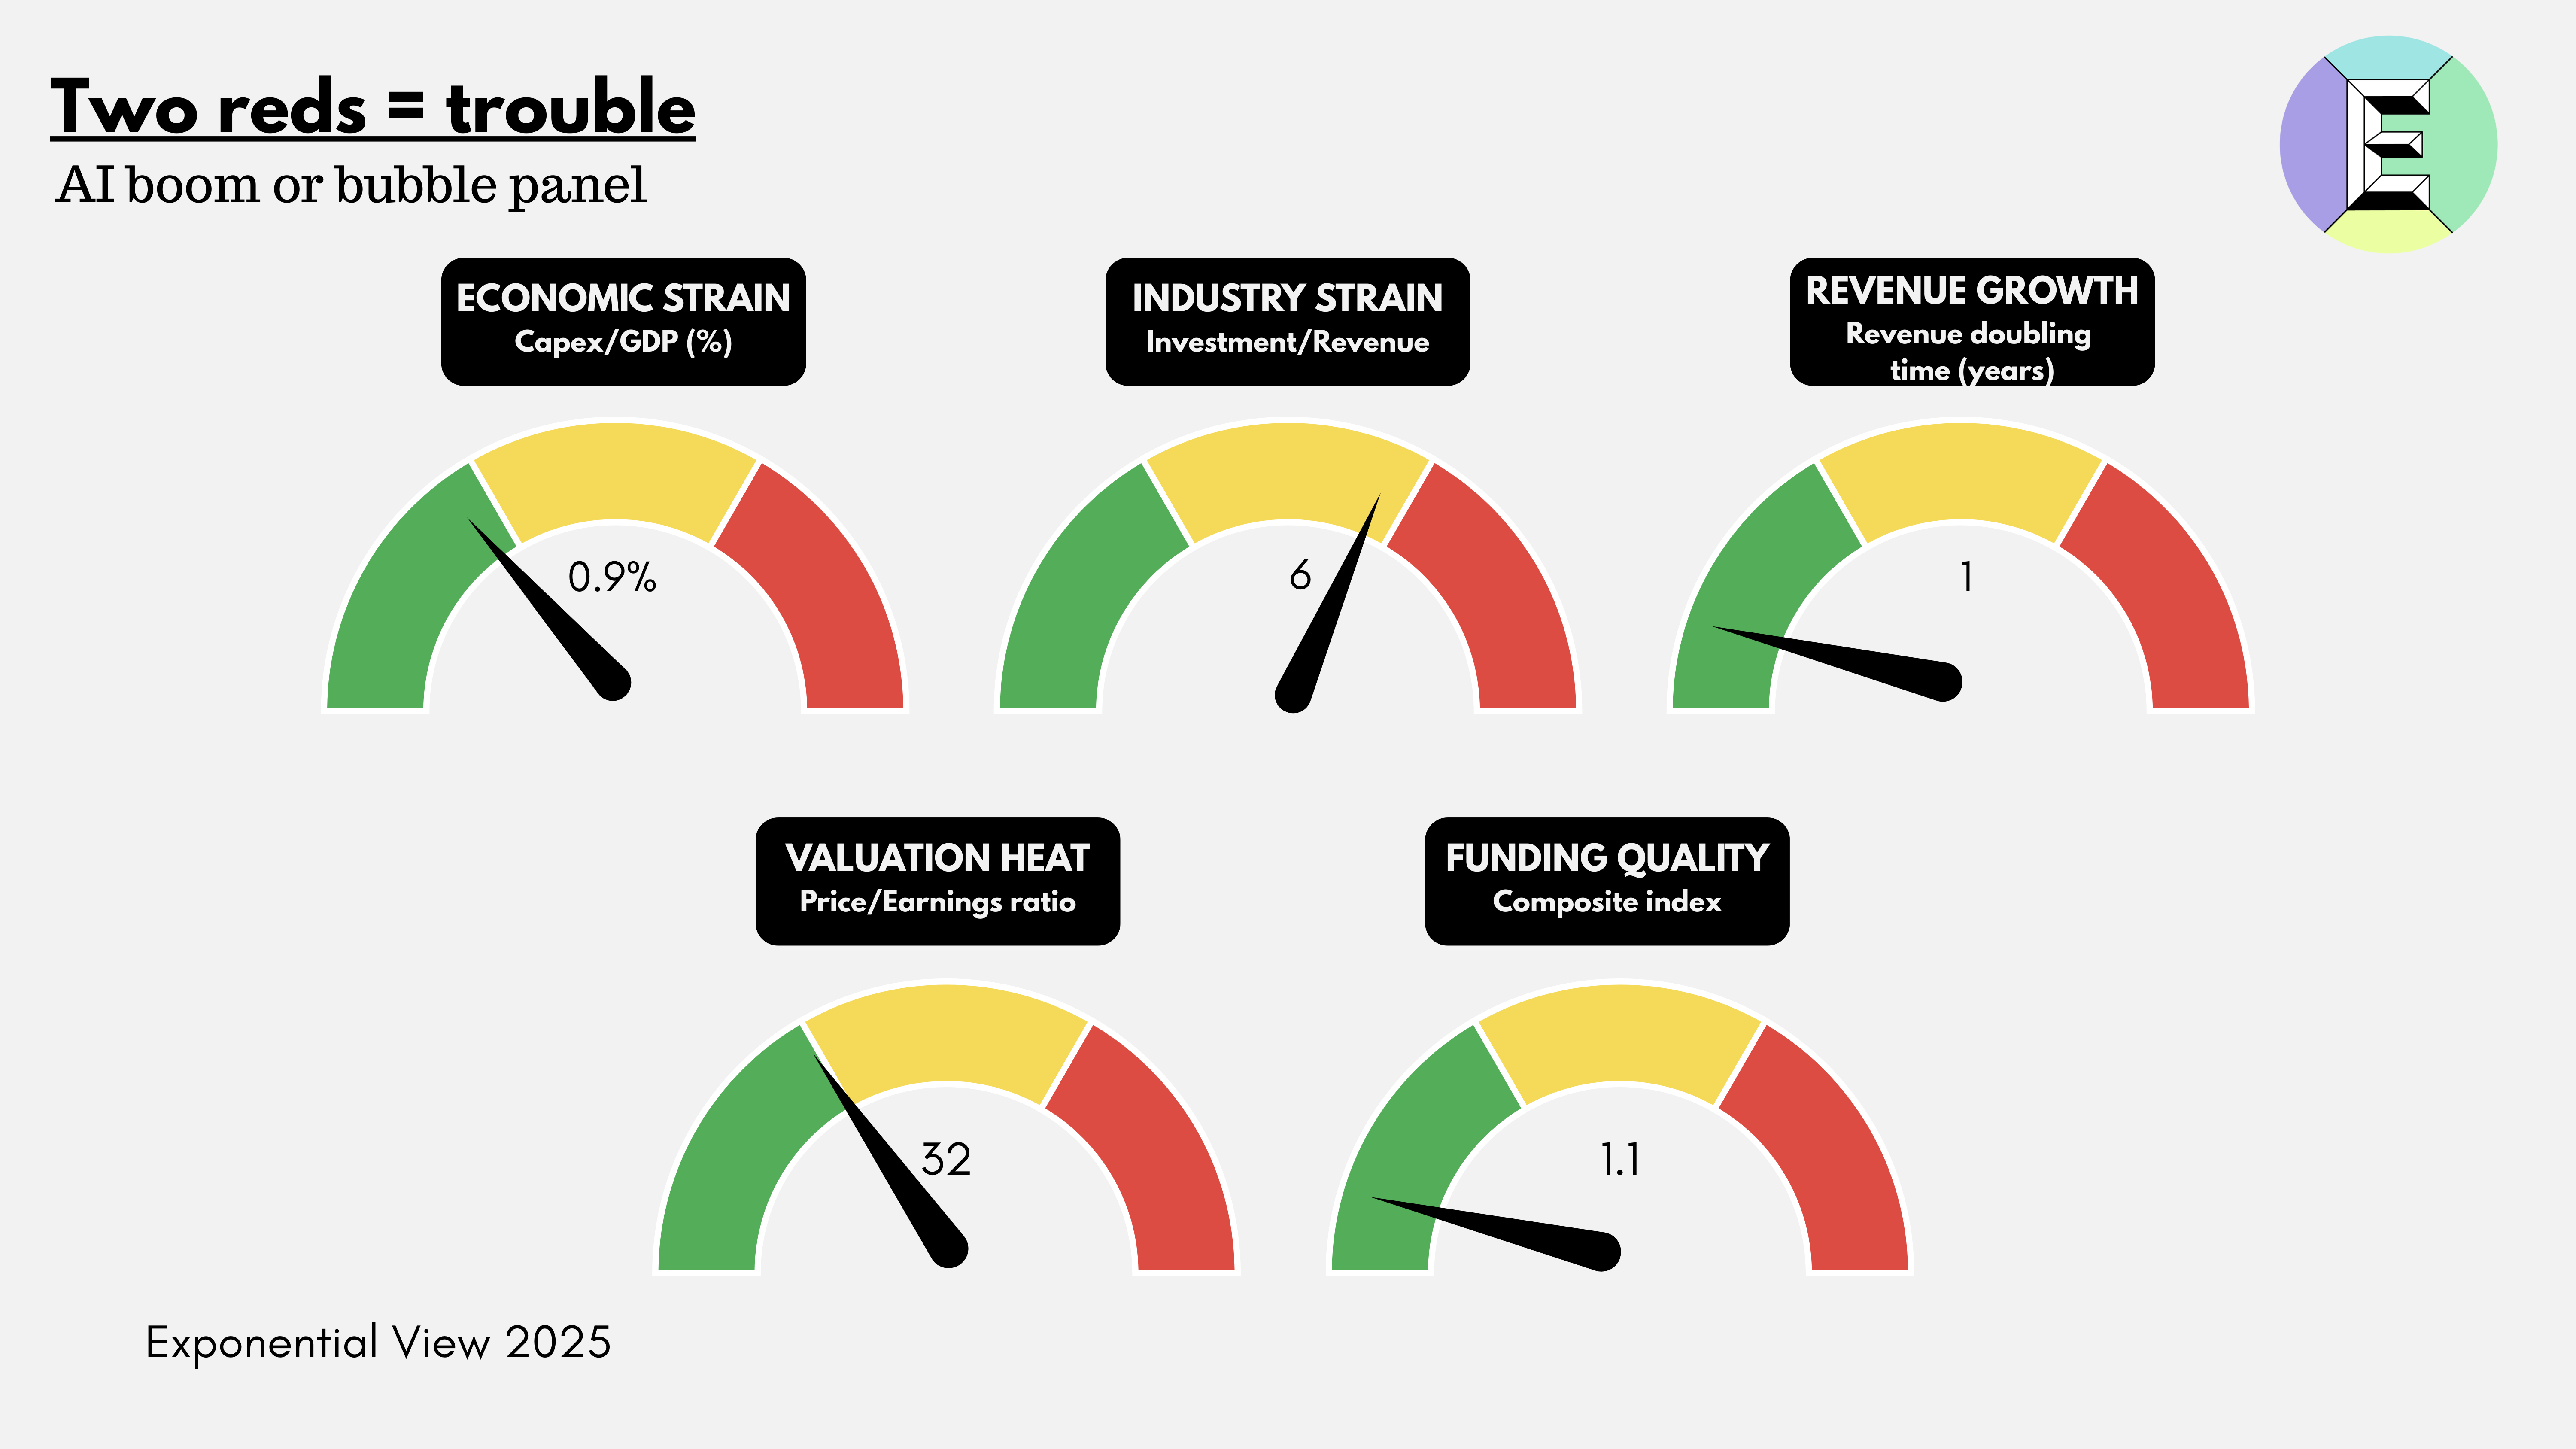
In the rest of the essay, I look at each gauge to explain why it may be green, amber or red, and at the end I pull them together into a full dashboard view.
Gauge 1: Economic strain
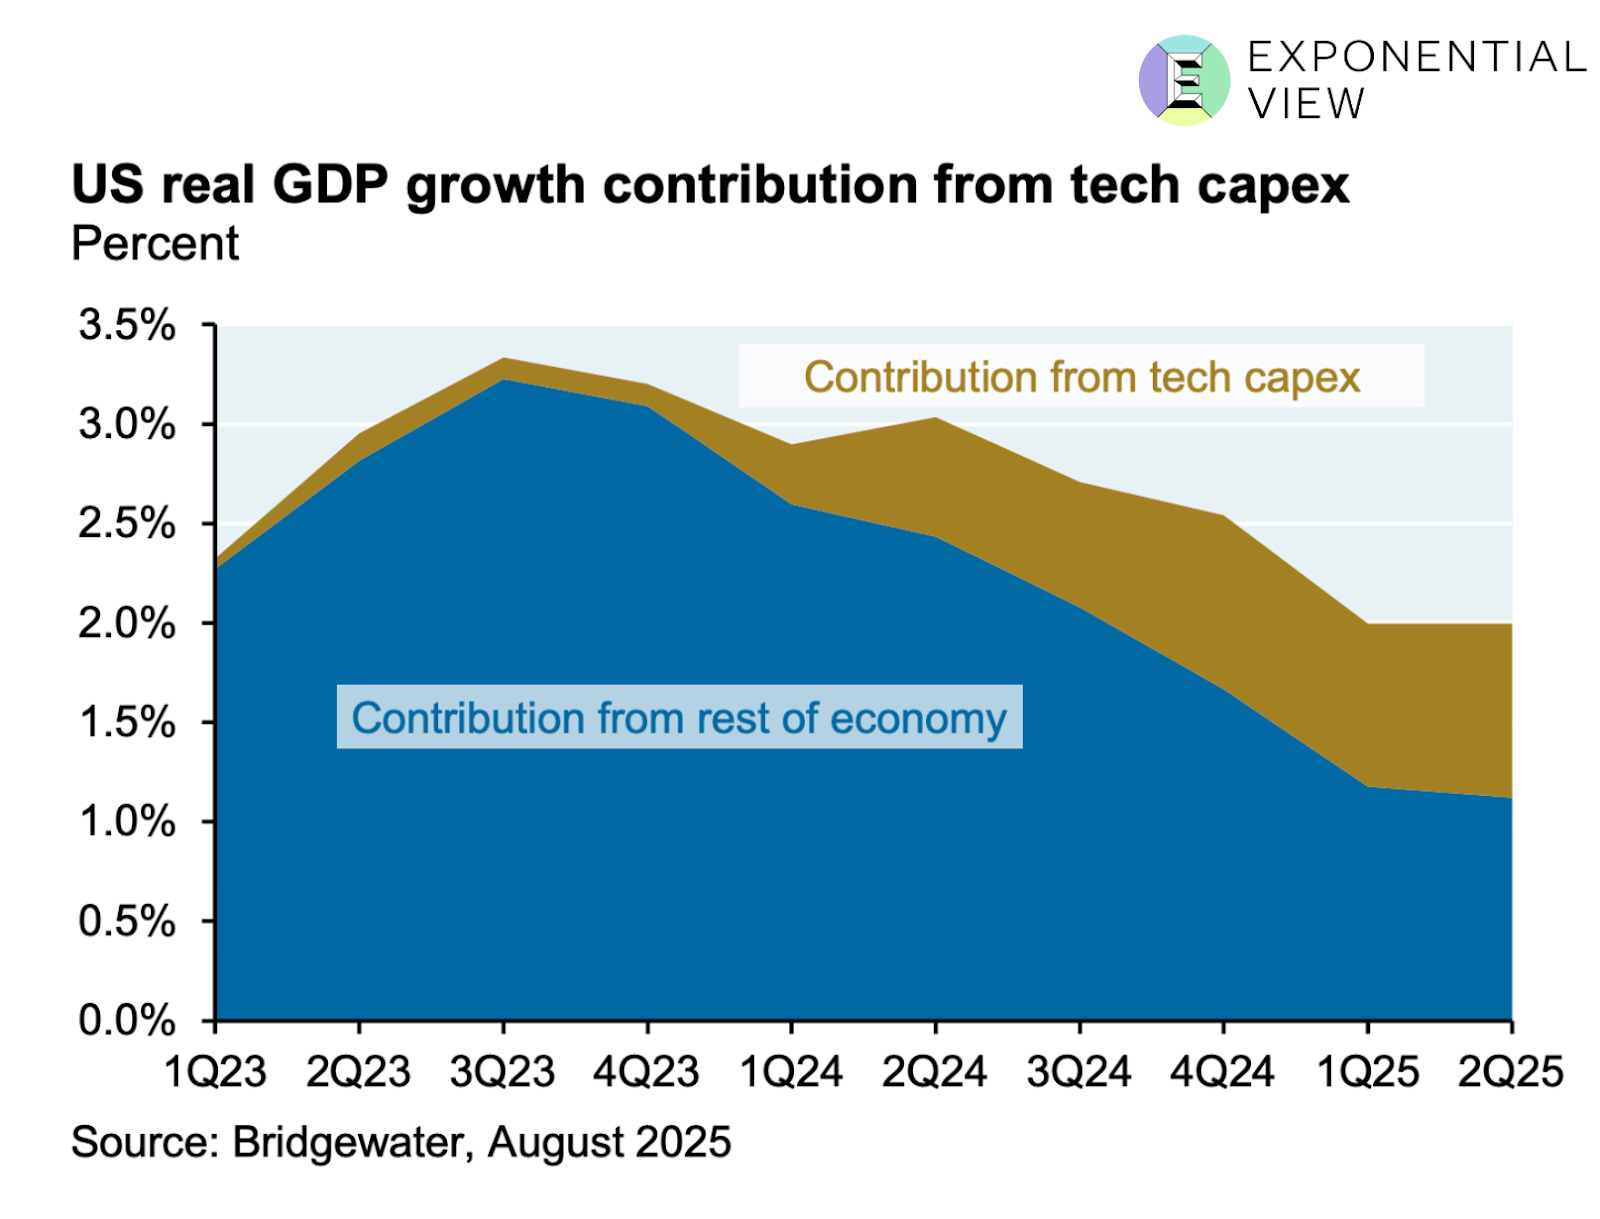
The investment underway is vast, with Morgan Stanley expecting $3 trillion in AI infrastructure spend by 2029. But it has not yet reached the runaway extremes of history’s great blowouts. What makes this dimension tricky is dependence. In the US, more than a third of GDP growth can be traced to data center construction.
This is not inherently bad, but it may be dangerous if the momentum falters. An economy leaning this heavily on one sector for growth can find the ground falling away faster than expected.
The surge of capital expenditure (capex), poured into the physical infrastructure that AI demands, is an act of optimism. This is what capex is. Money spent today in the belief that it will become a funnel of revenue tomorrow. If it’s well-placed today, it will eventually lead to productivity gains and economic expansion.
If you want to sell people hula hoops to promote their health and happiness, you need to buy hula hoops first. And somewhere down the line, there needs to be a factory making them. Funding that factory is capex. You deploy the capex to build a useful thing that you can sell. Capex investment is often, but not always, a precursor to a growing business.
AI data centers have a similar quality, and something more. They are not just factories for a single product; they are infrastructure. Microsoft, OpenAI and the US government all see it this way. They see compute as a foundational utility of the 21st century, no less critical than highways, railways, power grids or telecom networks were in earlier eras. I made the same argument in my last book, so you can guess where I stand. Excluding the US, sovereign governments have made more than $1 trillion in commitments to AI as infrastructure by 2030.
To build such infrastructure inevitably requires historic sums, on a par with the railway and electricity build-outs of the past. McKinsey projects that meeting AI-driven demand by 2030 will require around 156 GW of new electrical capacity — the size of Spain’s and Portugal’s grids combined. The firm estimates this will cost $5-7.9 trillion in capital spending. For context, this is about twenty times the cost of the Apollo missions. This would place AI data centers among the largest infrastructure build-outs in modern history.
But useful though infrastructure is, especially when private capital gets involved, things can get divorced from reality. The financing structure matters as much as the technology itself. The railways in the US were largely privately funded and suffered from multiple investment bubbles. Electricity and road systems, by contrast, benefited from greater public investment and coordination, and were less prone to speculative excess. A boom becomes dangerous when the resources it demands start to bend the whole economy around it. Wages get sucked into one sector, supply chains reorient to serve it and capital markets grow dependent on it. The snapback is vicious when expectations break.
One way to gauge the economic strain is to look at investment as a share of GDP, the portion of national output funneled into a single technological frontier. It is a crude but telling ratio. It shows how heavily the economy leans on one technological bet.
In the case of AI infrastructure, most of that spending takes the form of capital expenditures: the servers, cooling systems, networking gear, shells of concrete and steel and the power infrastructure required to keep them running.
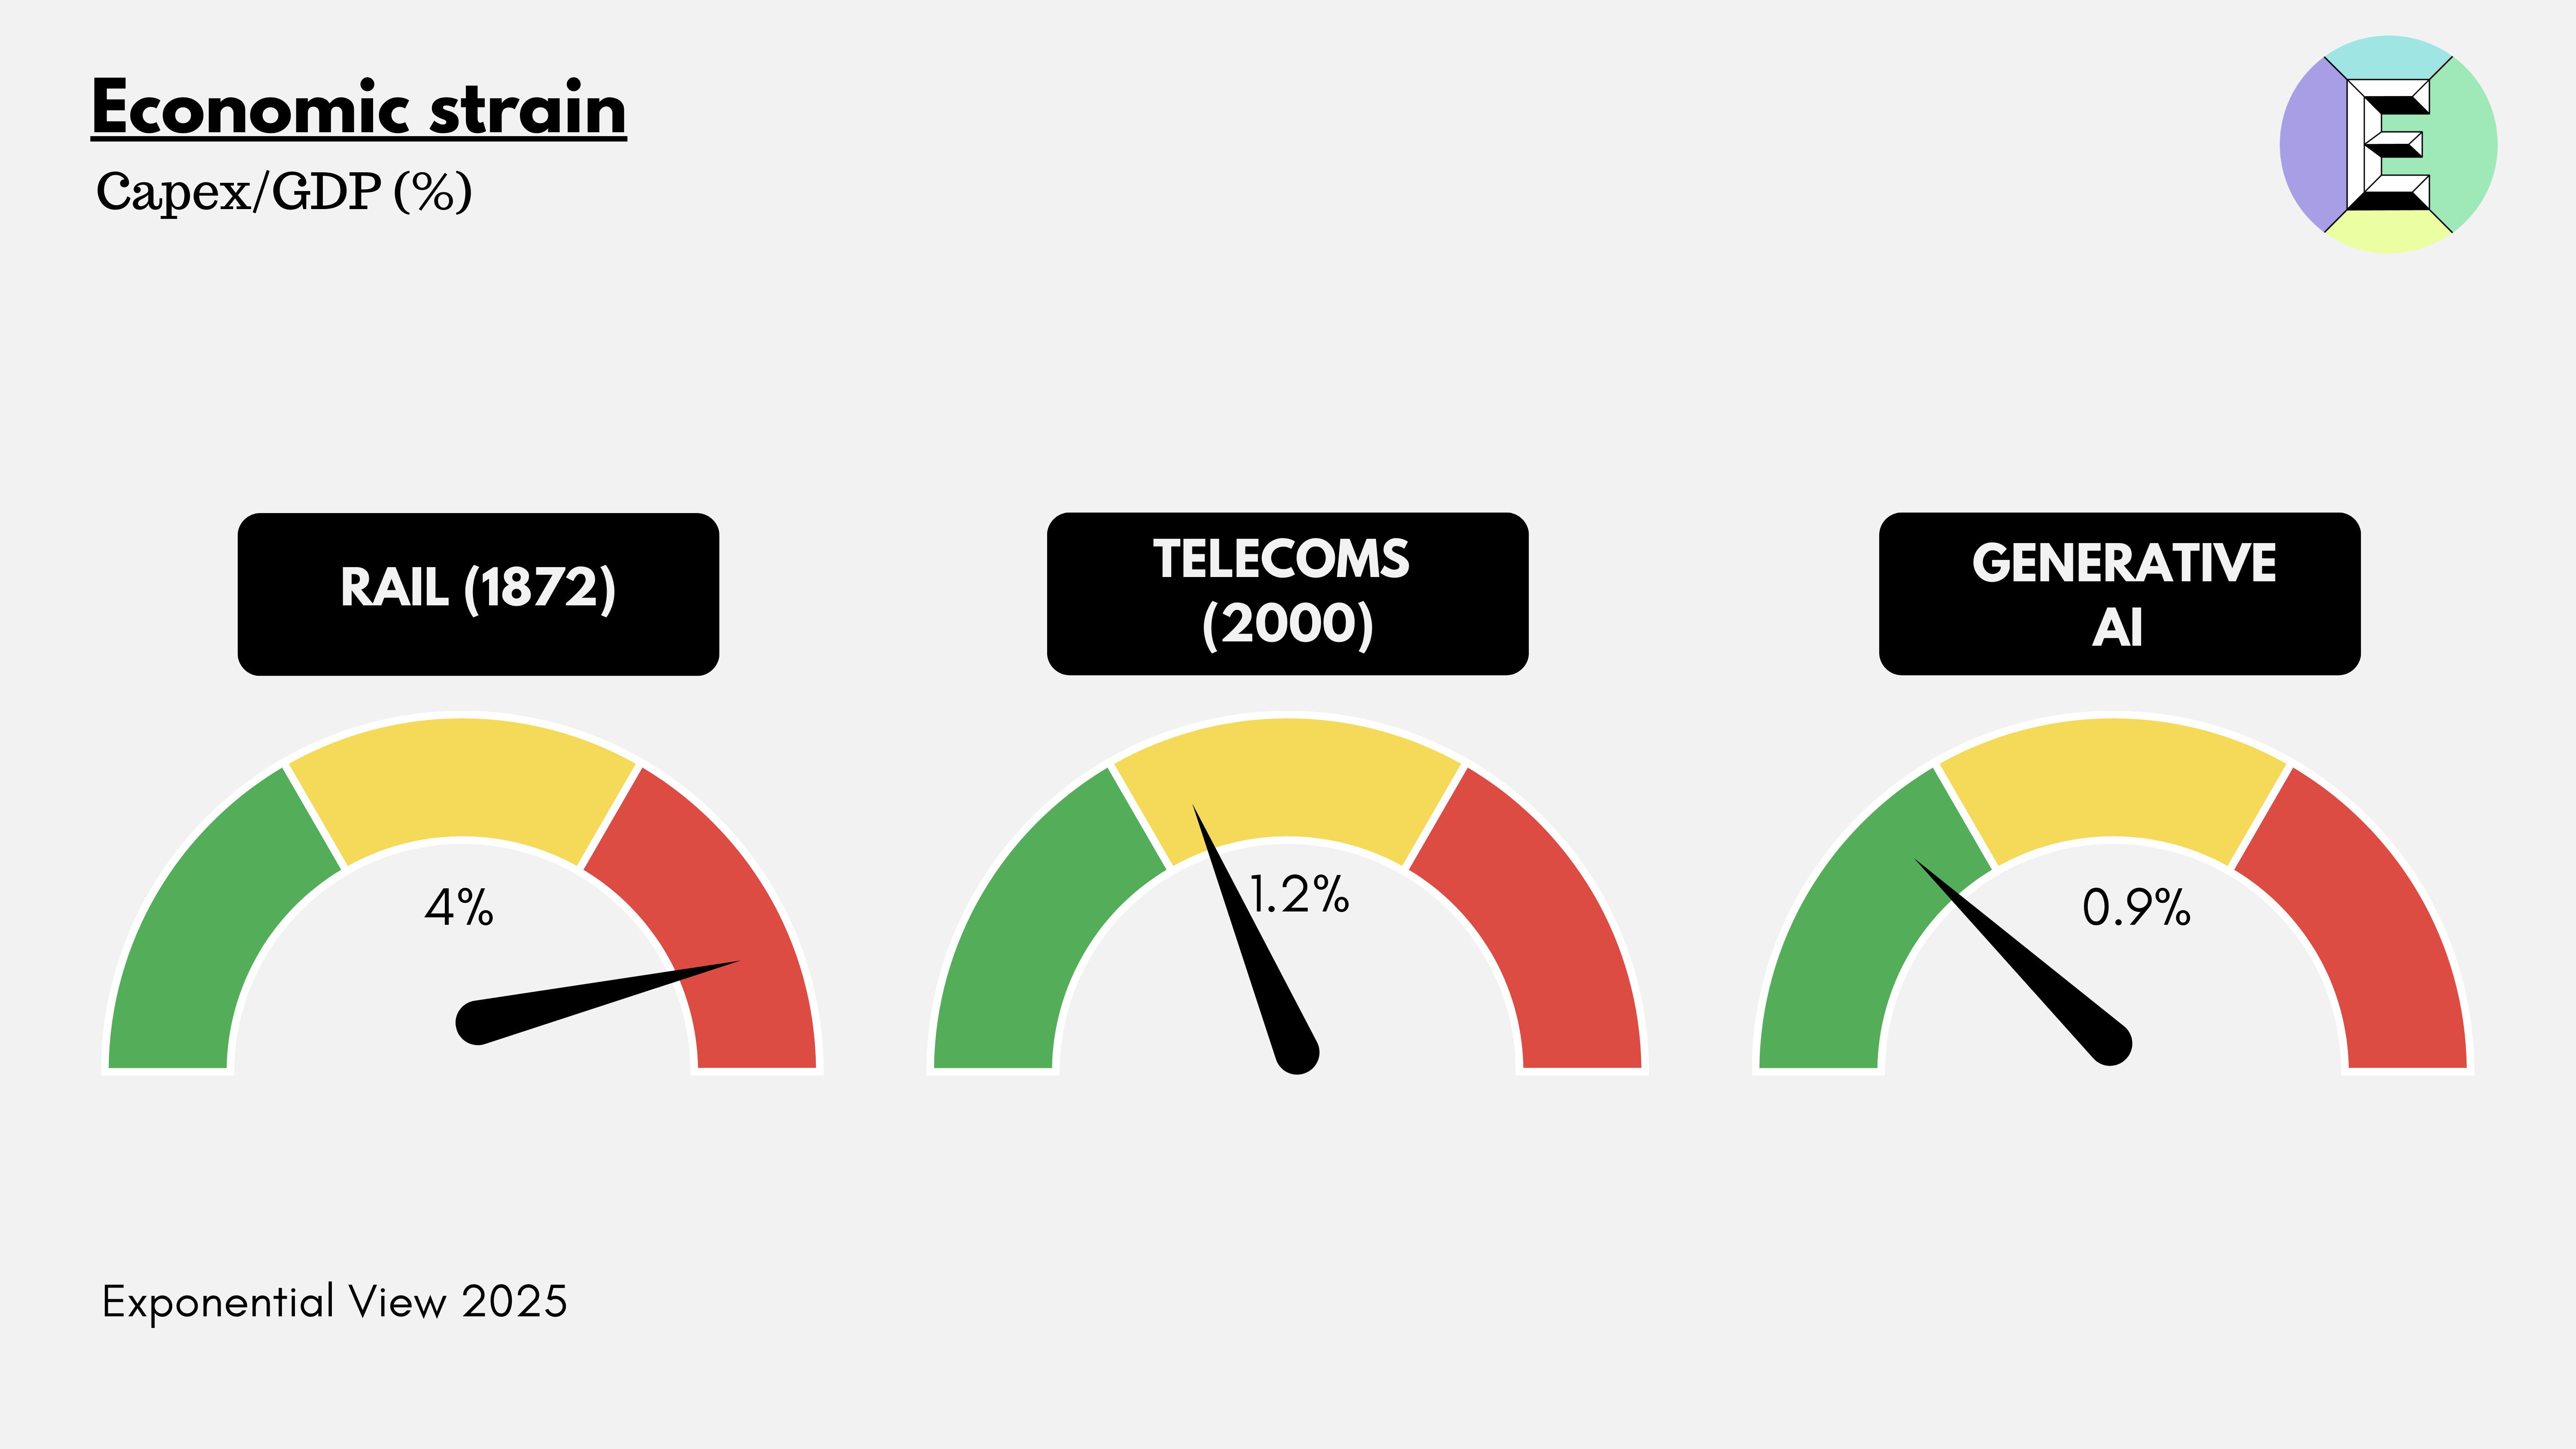
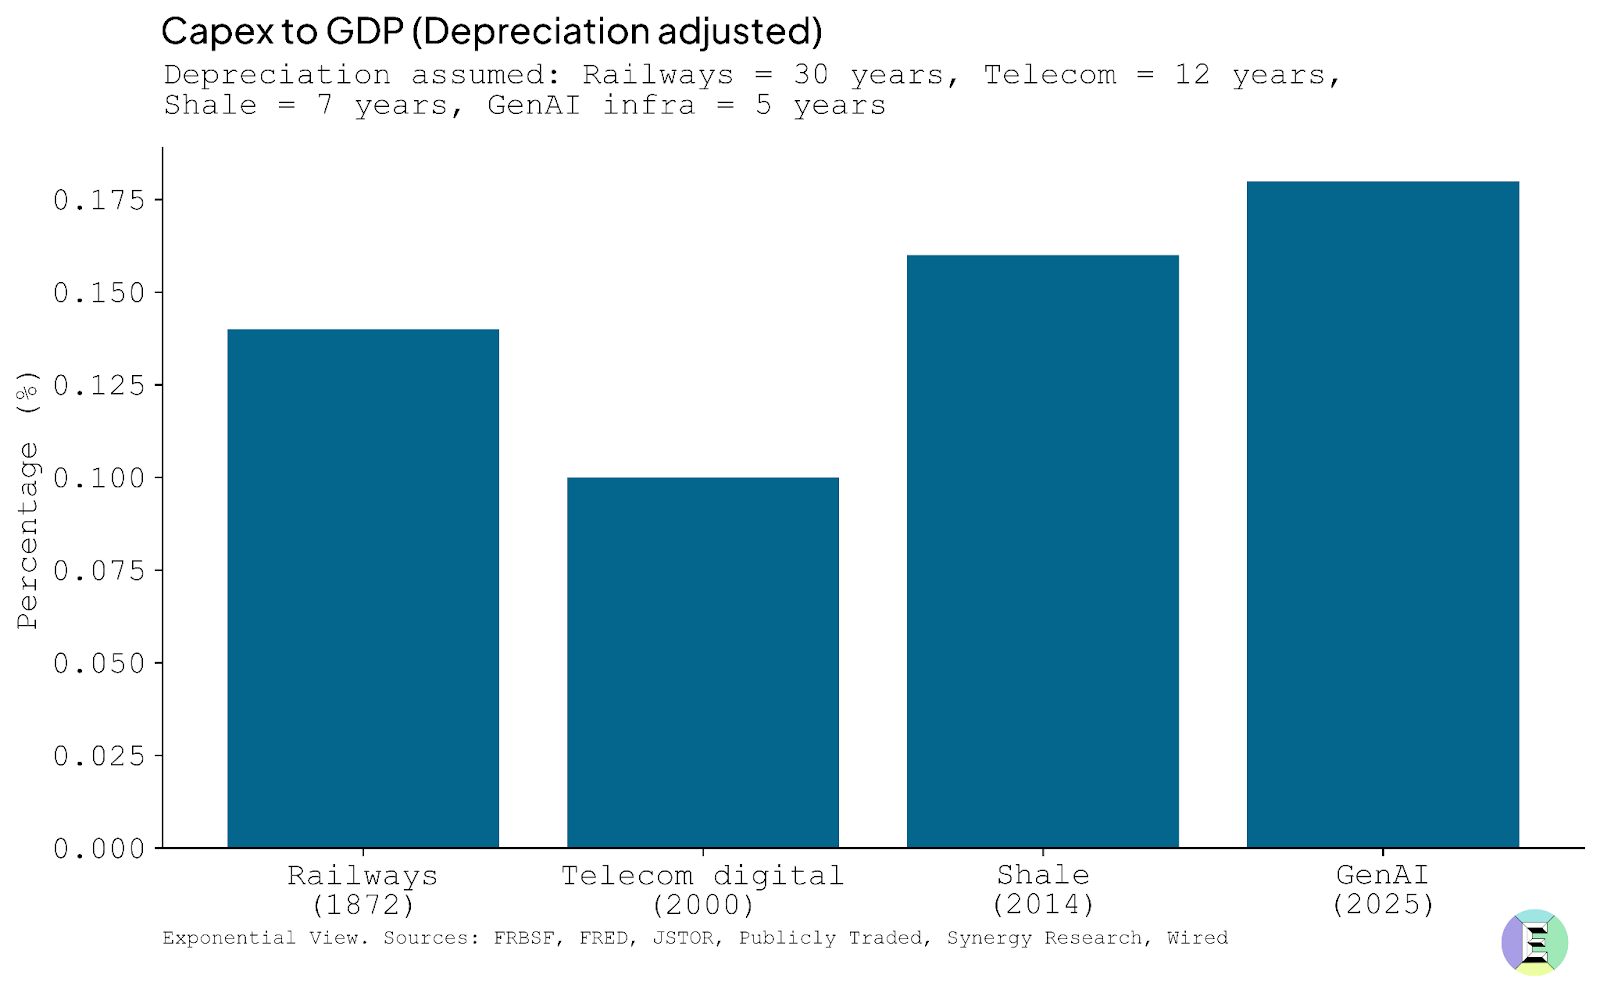
By that measure, the railway bubbles were the heaviest. In the United States, railway spending peaked at around 4% of GDP in 1872, just before the first great crash. The telecom boom of the late 1990s, by contrast, topped out near 1% of GDP, a level that looks familiar today.
The AI build-out sits in this middle zone. Around $370 billion is expected to flow into data centers globally in 2025, with perhaps 70% earmarked for the US,3 or roughly 0.9% of American GDP. Goldman Sachs projects spending will climb by another 17% in 2026. My own forecasts are in line with this view: annual capex of $800 billion by 2030, perhaps 60% in the US, which would bring the American share to 1.6% of 2025 GDP.
The economic-strain gauge has three segments: green up to 1%, amber up to 2% and red above 2%. So today, genAI sits in the green zone – just. Of course, given stated commitments, it looks like it’ll head into amber soon.
But there is a twist here that history’s bubbles did not face: rapid depreciation. Once laid, a railway track could last decades. The US was still running freight over 19th-century tracks well into the 20th. Telecom fiber rolled out in the 1990s still carries traffic 35 years later.
GPUs, by contrast, age in dog years. Their useful life for frontier applications such as model training is perhaps three years, after which they are relegated to lower-intensity tasks. Roughly a third of hyperscaler capex is going into such short-lived assets. They remain, in theory, monetizable in years five and six. The rest goes into shells, power and cooling that last two or three decades. Adjusting for asset life makes the AI build-out look even more demanding: unlike railroads or fiber, the system must earn its keep in a handful of years, not generations.
Whether this dynamic makes financial conditions worse or better is an open question. The pessimistic view is that a box of ripe bananas is worth less than the same value of Brazil nuts, because it must be consumed quickly. But the optimistic case is intriguing: shorter depreciation cycles may impose financial discipline on incoming investors. During the railway mania, decades-long asset lives masked the weakness of many business models; companies could stagger on for years before insolvency. In AI, the flaws may surface quickly, forcing either rapid adaptation or rapid failure.
The strain is noticeable but not yet unbearable. Venture funding at the AI application layer, while noisy, remains modest compared with the telecom mania of the 1990s.4 That suggests there may still be running room before the cycle overheats. The trillions pouring into servers, cooling systems and power lines may be essential, but history suggests they are not where the enduring profits accumulate. In railways, many track companies went bust, but the logistics firms and commodity barons riding their lines prospered. In telecoms, it was not the builders of fiber who captured the upside but the platforms and service providers that used the bandwidth. The same logic may apply to AI: hyperscalers shoulder the capex burden, but the durable value may accrue to those who control the models, the data and the ecosystems built on top.
This brings us to the second gauge on the dashboard: industry strain.
Gauge 2: Industry strain
Every boom needs to prove that the money poured into new equipment is starting to earn its keep. In any growth stage, it is unlikely that revenues will cover investment, but they should be non-zero. This gauge looks at the ratio of capex to revenues.
We estimate that genAI revenues look on track to exceed $60 billion this year, from roughly nil five years ago.5 This number could well undercount the value being generated by genAI. Meta, for example, has suggested that the technology has increased conversions on its platforms by about 3–5%. Indirect effects like this may help explain why some analysts, such as Morgan Stanley, peg 2025 revenues far higher than our estimate, at $153 billion.
The big hyperscalers, such as Google, Microsoft and Amazon, are without doubt moving into a phase of higher capex intensity. In 2021, before ChatGPT, hyperscalers invested about 44% of their operating cash flow in capex. By 2024, that had risen to 68%. In 2025, it will be higher still. But, as Pierre Ferragu of New Street Research points out, these firms can absorb this shift by replatforming, with structurally higher capital intensity driving growth and efficiency gains. This dynamic has been in place for a decade already: between 2015 and 2018, Microsoft Azure’s capex represented between 70% and 90% of revenues. It was an investment in the future.
This makes for an interesting comparison to earlier boom cycles. The railroads are particularly pertinent. The railroads’ direct revenue contribution was tiny compared to the value the railroads created in the US economy. Railway bubbles were always tethered to the reality of cash flow. The bonds issued to finance new track and rolling stock had to be serviced out of passenger fares and freight revenues. Whenever capex outpaced earnings, the strain showed. The manias of 1873, 1883 and 1887 all followed the same pattern: a sharp decline in the ratio of annual revenues to capital spending, and in some cases, outright revenue contraction.

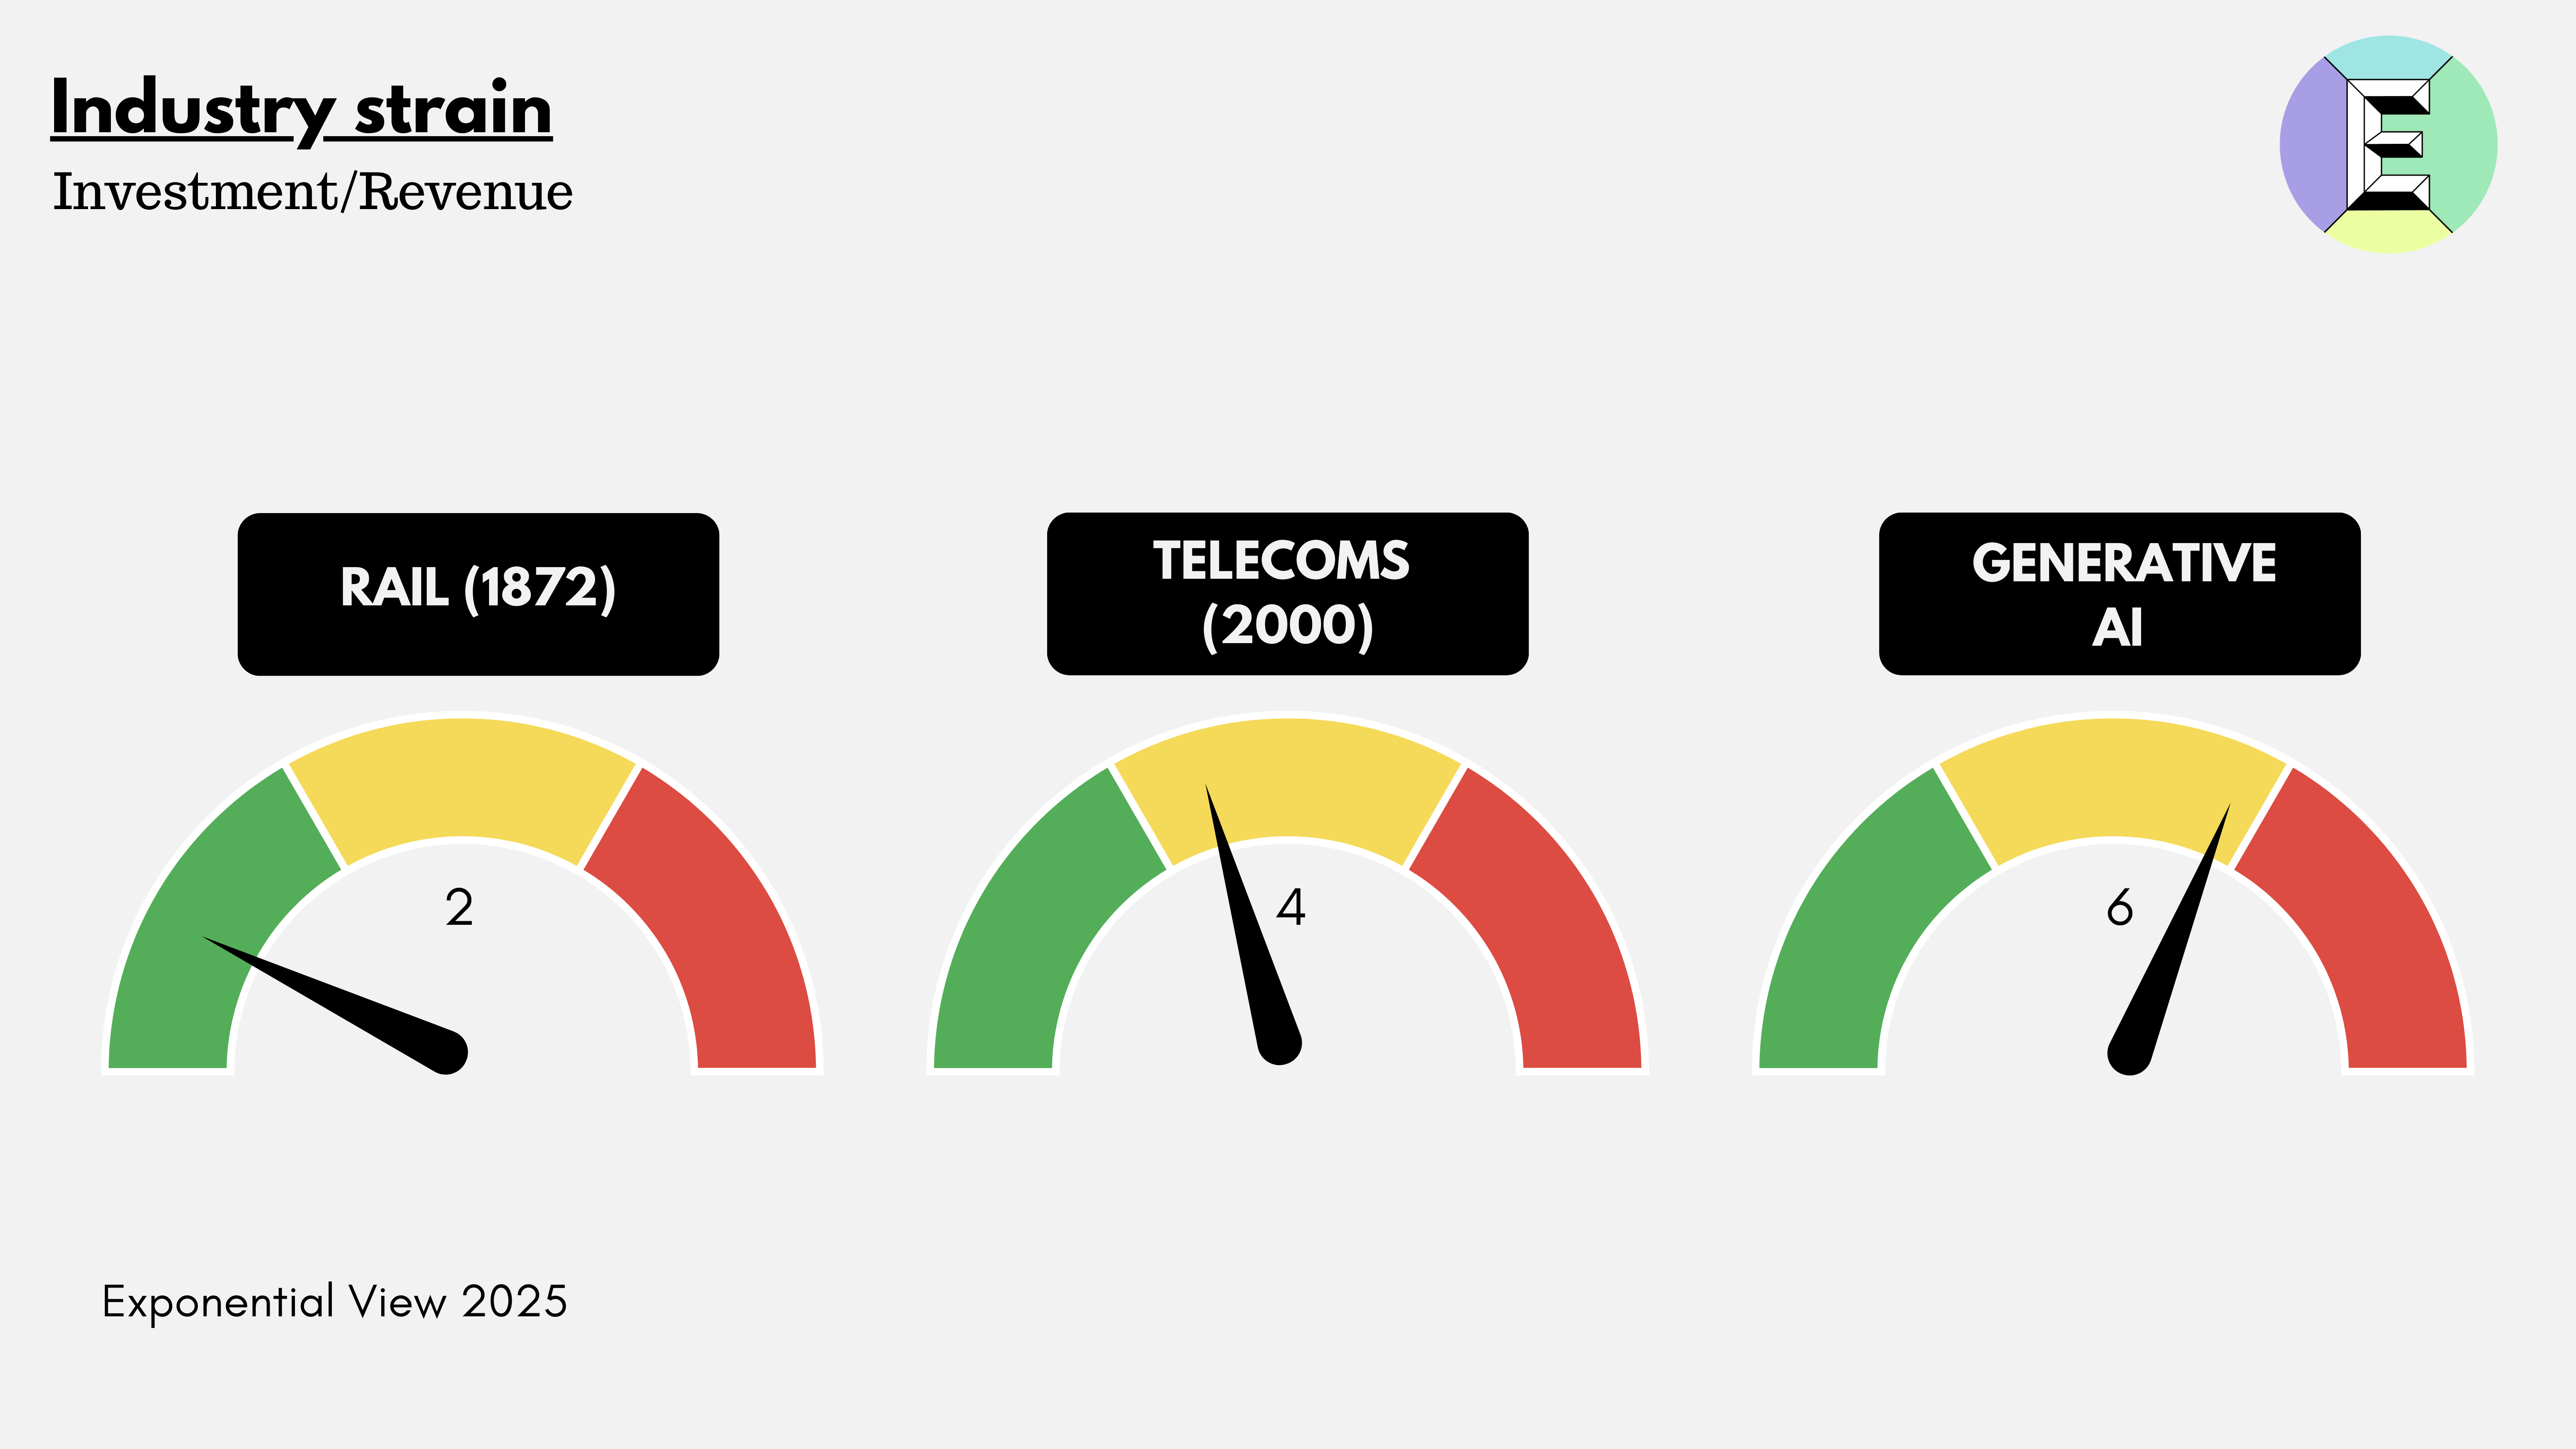
At the height of the US railroad expansion in 1872, capex was around two times revenues. In the late-1990s telecom bubble, capex amounted to just under four times revenues. By contrast, today’s genAI boom runs on roughly $60 billion in revenues against about $370 billion in global data center capex – a capex-to-revenue ratio of six times, the most stretched of the three.6
On the industry-strain gauge, railways sat healthily in the green. GenAI is in amber, nearing red.
It’s not quite a warning sign, not least because genAI has people clamoring for access to AI data centers. One report suggests that enterprise customers are committing to capacity before data centers are even built. What is driving that is usage, and with that comes astonishing revenue growth.
Gauge 3: Revenue growth
The problem in the railroad and telecom booms was not sector strain per se, but that revenues ran out of momentum. Investment expects a return. After the railway bubble burst in 1873, revenue declined by 3% year over year. Telecoms did slightly better, declining 0.5%.
Before the crashes, revenue growth was hardly explosive. Railways in 1873 expanded 22% – enough to double in three years. Telecom in the late 1990s managed only 16%, a doubling time of just over four years.
By contrast, genAI revenues are still accelerating. By our estimates, genAI revenues will grow about twofold this year.7 And this is likely a conservative forecast. Citi estimates that model makers’ revenue will grow 483% in 2025. OpenAI forecasts annualized growth of about 73% to 2030, while analysts like Morgan Stanley estimate this market could be as large as $1 trillion by 2028, equivalent to compound growth of ~122% a year over the period.
Our revenue growth gauge is an exponential one. It measures revenue doubling time in years; that is, at current growth rates, how long does it take for sector revenue to double? Here, genAI sits squarely in the green, doubling every year.

Much of this spending flows down to the hyperscalers and neoclouds that run the infrastructure. Hyperscalers make tons of money, so they can afford to invest, trimming a few points off earnings if they think it positions them well for the future. Oracle projects that its cloud business could generate around $380 billion in cumulative revenues by 2030.
In my conversations with large companies, I get the strong sense that they can’t get enough of this technology right now. And this likely supports the strong growth rates. IBM’s CEO survey shows that genAI is already expanding IT budgets, with 62% of respondents indicating they will increase their AI investments in 2025. Demand is so high that new data centers are at full utilization as soon as they come online, with Amazon CEO Andy Jassy noting that “as fast as we put the capacity in, it’s being consumed” and Sam Altman remarking that a lack of compute was affecting model upgrades. Jensen Huang expected this would happen early in 2024, predicting that demand for both Hopper and Blackwell chips would outstrip supply well into next year.
Some 9% of US firms have one useful genAI use case. Back-of-the-napkin math suggests that 9% will become 75% within five years, and the number of use cases will rise from one to hundreds.8
That on its own points to a thousandfold increase in something. I say *something* because the current billing-by-token model may change.9 Even if it doesn’t, we’ll see dramatic price declines on per-token pricing, likely by orders of magnitude. The underlying point is that we are still at the foothills of enterprise use. For now, firms can barely secure enough tokens to meet their needs.
The consumer side tells a parallel story. US consumers already spend about $1.4 trillion a year online. This could plausibly double to $3 trillion by 2030 if it grows at 15–17% a year (it has grown at more than 14% a year since 2013). Against this backdrop, a genAI app sector rising from today’s $10 billion to $500 billion within five years looks less far-fetched. Exponential growth rates of 300-500% are already visible in mid-sized startups and the large model providers (see last week’s essay on OpenAI’s valuation), suggesting that even a small reallocation of consumer digital spending could drive revenues into the hundreds of billions.
Taken together, these signals point to an industry still in strong ascent, unlike the relatively meager revenue growth that preceded the railroad and telecom busts. If genAI revenues were to grow at even half the pace of last year, then, on my conservative forecast, they would reach $100 billion by 2026, covering about 25% of that year’s capex.
Gauge 4: Valuation heat
If economic and industry strain show the weight of the boom and revenue growth its trajectory, valuation heat is the mood of the market. This is often where bubbles reveal themselves most clearly: how exuberantly investors are pricing the sector, regardless of fundamentals. As Carlota Perez has argued for decades, financial markets tend to overshoot in the early “installation phase” of each technological revolution, pouring in capital far beyond what near-term revenues justify. The frenzy looks irrational in the moment, but it is the mechanism by which society lays down the new infrastructure. The challenge is whether the frenzy can evolve into the “deployment phase,” when the infrastructure becomes universal and delivers real productivity gains.

The dot-com bubble is the archetype. Companies with no profits at all floated at triple-digit multiples, some raising more on IPO day than they would ever earn in revenues. Boo.com raised $135 million from investors, including LVMH’s Bernard Arnault, and pitched itself as the “Amazon of fashion.” The site launched in 18 countries with localized language and shipping, with a virtual avatar, “Miss Boo,” who gave shopping tips on 3D models.

It spent $25 million on advertising before launch, ballooned staff from 40 to 400, and opened plush offices across New York and Europe. The JavaScript- and Flash-heavy website was nearly unusable on dial-up connections, incompatible with Mac computers and buggy. One in four attempted purchases failed. Despite the extravagance – lavish parties, Concorde flights and celebrity stylists for Miss Boo – polls showed that just 13% of internet users knew the brand existed. Within 18 months, the money was gone. Boo.com collapsed in May 2000.10
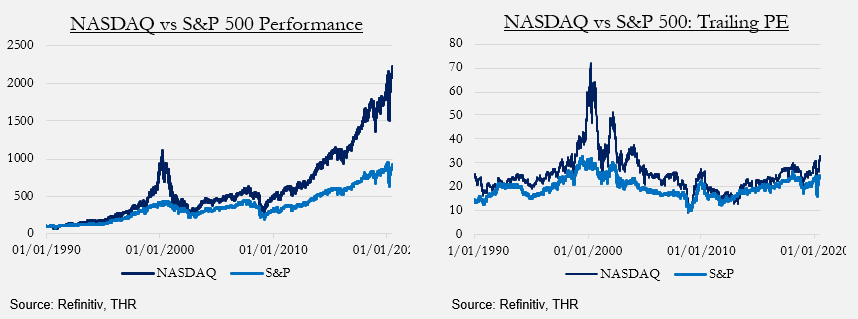
What’s going on in genAI does not compare to this. The key measure here is the price/earnings ratio (P/E), a shorthand for how many years of current profits an investor is effectively paying for. If a company has $1 in annual earnings and trades at a P/E of 20, buyers are paying $20 for each dollar of current profit, assuming growth will make that worthwhile. A high P/E means companies are betting on rapid future growth, but too high, for too long, investors might be buying into a fantasy. This was the case in the dot-com era. At the peak, the Nasdaq traded at a P/E of about 72. One detailed study estimated that internet stocks alone carried an implied P/E of 605. In other words, investors were willing to pay for more than six centuries of current earnings. The issue wasn’t that demand disappeared – Amazon’s revenues grew from $2.76 billion in 2000 to $3.12 billion in 2001 – but that no company could grow fast enough to justify those sky-high expectations. The fundamentals improved, but expectations collapsed.
Today, the picture is much calmer. The Nasdaq P/E is about 32, half that of the dot-com era. The broader tech market is higher than the long-run average, but nowhere near dot-com territory. Compared to the railroad bubbles, which had an estimated P/E of around 20, it is high. But the railroads ended badly, not because valuations were extreme in themselves, but because revenue growth faltered. By contrast, genAI revenues are still accelerating rapidly.
Another indicator of valuation excess that many investors pay attention to is the so-called “Buffett Indicator”, which measures how far ahead of GDP equity market valuations have risen. There is no doubt that this indicator is peaky, well above a two-standard-deviation anomaly that often presages market corrections. We are more sanguine, for the moment. History rhymes; it doesn’t repeat. The Buffett indicator relies on GDP, and GDP is famously bad at capturing technological productivity gains. In addition, a large portion of big tech revenues comes from outside the US, decoupling their earnings from domestic GDP. Finally, AI-based productivity may affect margins – keeping output (and GDP constant), while increasing corporate profits. So while we keep an eye on the Buffett indicator (and its distant cousin, the Shiller CAPE ratio), we feel the different dynamics of an accelerating digital economy are not well captured by them.
So how hot is this gauge? My verdict is green. Prices haven’t yet broken free of gravity in the way dot-com valuations did.

Gauge 5: Funding quality
Funding quality is not a standard metric but a composite judgment. It asks who the money is coming from, how it is structured and whether the capital is willing to wait years for returns or rather chase quarterly pops. Low-quality capital, in short, is short-termist, undisciplined and debt-laden; it rushes and flees quickly. High-quality capital is more patient, better underwritten, and able to withstand volatility.
Every bubble has its signature weakness, invariably rooted in how it was financed. Railways were fueled by speculative retail investors with little capital behind them. By the early 1870s, funded debt averaged 46% of total assets among American railroads; when overbuilding met a credit squeeze, financing evaporated. The Panic of 1873 sent rail lines into receivership.
Dot-com firms, a century later, were a little sturdier. Venture capital was a boutique business in 1995, with only $5.3 billion deployed. By 2001, more than $237 billion had been poured into startups, often by new and inexperienced managers. The frenzy spilled into public markets: IPO volume between 1999 and 2000 ran six times above historical averages. Companies went public with little revenue. Two of my friends took theGlobe.com public in 1998 and enjoyed a 606% share-price pop the day they went public.
Telecoms in the late 1990s leaned on mountains of cheap debt. US and European carriers doubled and quadrupled their leverage in just a few years. Deutsche Telekom and France Télécom together added $78 billion in net debt between 1998 and 2001. When revenues failed to keep pace, defaults rippled through the sector.
In each case, the capital that fueled the boom proved ephemeral. But the degree of fragility differed. Railways and telecoms were most exposed to credit crunches, with debt ratios ballooning. Dot-coms were hostage to market mood, with equity values evaporating.
On this front, today’s AI boom looks sturdier. Microsoft, Amazon, Alphabet, Meta and Nvidia are minting extraordinary cash flows, easily enough to bankroll their own build-out. For now. But investment needs are racing ahead. Morgan Stanley reckons total global data center capex will hit $2.9 trillion between 2025 and 2028. Hyperscalers can cover perhaps half of that from internal cash. The rest must come from private credit, securitized finance and new operators. Governments have also pledged $1.6 trillion in sovereign AI investments, and Gulf capital is seeking new opportunities.

Here is where the risks creep in. Morgan Stanley itself points to a $1.5 trillion gap that will need to be plugged by debt markets and asset-backed securities. The sums are enormous: $800 billion from private credit, $150 billion in data center ABS,11 and hundreds of billions more in OEM loans and vendor financing.12 That $150 billion alone would triple the size of the data-center securitized markets almost overnight. And not every borrower looks like Microsoft.
Consider CoreWeave, an Nvidia-backed upstart now going public with $8 billion of debt. It has already slipped into technical default on loans, missing covenants without being insolvent, and its revenues depend on just two customers. Its economics rest on renting GPUs that depreciate by 20–30% per year, more like a WeWork lease than a hyperscaler’s durable balance sheet.

In other words, the foundation is stronger than in past bubbles, but the superstructure is starting to resemble the old pattern. Esoteric debt structures, concentrated counterparties and hardware that may not hold value are reappearing. If genAI revenues grow tenfold, creditors will be fine. If not, they may discover that a warehouse full of obsolete GPUs is a difficult thing to secure.
For now, my gauge is greenish. We’re not yet in bubble territory, but if financing keeps creeping this way over the next year without revenue growth as robust as 2025’s, it might tick over to amber.
Where does this leave us?
On the basis of these gauges, genAI remains in a demand-led, capital-intensive boom rather than a bubble. But booms can sour quickly, and there are several pressure points worth watching:
If investment climbs toward 2% of GDP, it could suggest the economy is overweighting AI relative to its productivity returns; equally, if one or more hyperscalers were to cut capex by more than a fifth over the next three to five years, that would mark a sharp turn in sentiment that could trigger a rapid decline among other players.
A sustained fall in current enterprise and consumer spending levels would be another warning, especially if foreshadowed by a shrinking Nvidia order backlog. At the same time, the economics need to improve: revenues per dollar of capital should move toward the 0.5–1.0 range. Should the gap fail to close, it would imply that scale is not delivering the expected efficiencies.
If valuations start approaching a P/E ratio of 50-60, it would look frothy, since a genuine growth phase should see earnings catching up with prices, not lagging further behind.
If internal cash covers less than 25% of capex, data center investment stability comes under pressure. Right now, stability comes from hyperscalers’ strong cash flows. If they stop covering the majority of capex, then more debt and securitization will creep in. Not great given a GPU’s depreciation cycle. If internal funding slips below a quarter of new capex and reliance shifts toward debt and securitization, the sector’s dependence on short-lived GPUs and its exposure to higher interest rates could quickly become destabilizing.
My current heuristic is that if two of the five gauges head into red, you’re in bubble territory. Time to sell up, buy the VIX and take some deep breaths.
In the year prior to the Panic of 1873, the railroad’s economic strain turned red, accompanied by a decline in funding quality. Anemic revenue growth didn’t help. With the telecoms crash of 2001, revenue growth and funding quality blared red. In the dot-com era, it was industry investment strain and valuations.
GenAI isn’t there yet. Racing fast, the engine is whining, but not overheating. How long would it take for two gauges to get into the red? I’ve toyed around with combinations, and most scary scenarios take a couple of years to play out. (And not all scenarios are scary.) That said, so many macro factors, from a recession in the US, to rising inflation, a challenging interest-rate environment, and domestic or international politics, could dampen spirits. While we might not be solidly in bubbleland, it would be hubristic to assume the AI investment cycle is immune to those exuberant dynamics.
Onward. For now.
I even wrote a blurb on the 1999 book The Internet Bubble.
Edward Chancellor’s book on bubbles is a useful guide.
Last year, SemiAnalysis forecast that around 70% of data center capacity build-out will happen in the US over the medium term.
Adjusted for inflation, VC investment in the internet in 2000 was $85.9 billion; Dealroom.co reports $47 billion for the AI application layer last year – a difference of $38.9 billion.
Revenues are compiled from primary corporate disclosures (SEC filings, earnings transcripts, investor presentations, press releases) and supplemented by analyst and consultancy estimates (McKinsey, Gartner, IDC, etc.) where company reporting is incomplete. We prioritize disclosed figures, adjust for potential double-counting in revenue-sharing agreements (e.g., OpenAI–Microsoft), and categorize revenue streams (subscription, API, infrastructure, licensing) to maintain comparability. Private-company revenues (e.g., Anthropic, Midjourney) rely on reported run-rates or credible press/VC sources, flagged as estimates.
Our model shows 130% growth among AI companies year over year.
Starting from about six million US firms, assume 9% (about 540,000) now have one useful genAI use case; project adoption to 75% (about 4.5 million) within five years, and average use cases per adopting firm to rise from about 1 to about 100 – yielding roughly 450 million use cases, an increase of about 830 times; illustrative, not a forecast.
Most genAI services today are billed “by the token.” A token is a unit of text, usually about four characters or ¾ of a word. Customers are charged for tokens processed in prompts and responses (for example, a 1,000-word output might equal ~1,300 tokens). This model directly links cost to usage, but it may evolve as enterprises negotiate flat-rate contracts, consumption bundles, or outcome-based pricing.
I spent an afternoon walking through Boo’s deserted offices after the collapse to see if any physical assets retained value.
Asset-backed securities are bonds sold to investors, backed by cash flows from a pool of underlying assets. In this case, the assets are data center leases or infrastructure contracts, allowing operators to raise capital by securitizing predictable rental or service revenues.
OEMs (original equipment manufacturers) such as Dell, Cisco or Nvidia often extend credit to customers or partner with financing arms to help them buy hardware. Vendor financing is the broader term for suppliers lending to buyers, typically repaid out of the revenues generated from using the purchased equipment.