
📊 EV’s Charts of the Week #91
Ethereum, book sales & music, angel investing++
Hi, I’m Azeem Azhar. I convene Exponential View to help us understand how our societies and political economy will change under the force of rapidly accelerating technologies. Every Wednesday, I do this in Charts of the Week.
CHART OF THE WEEK
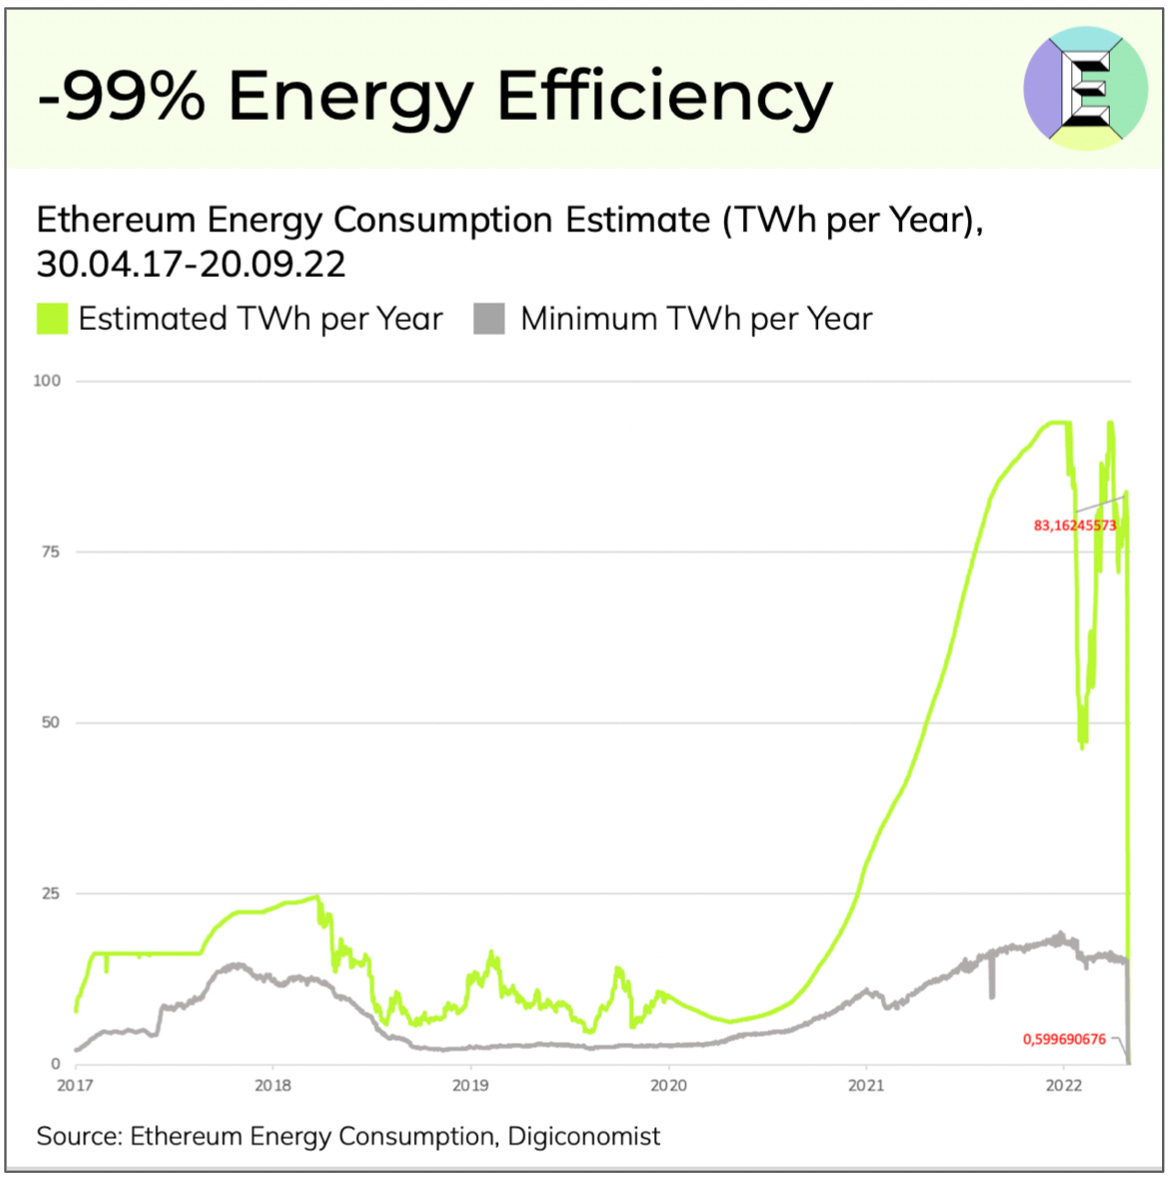
Ethereum’s energy consumption has dropped from a peak of roughly 94 TWh per year (approximately the level of Pakistan or Poland) to 0.01 TWh per year (equivalent to the energy consumed by about 700 average British homes annually.)
DEPT OF INEQUALITY
The middle isn’t where you think it is
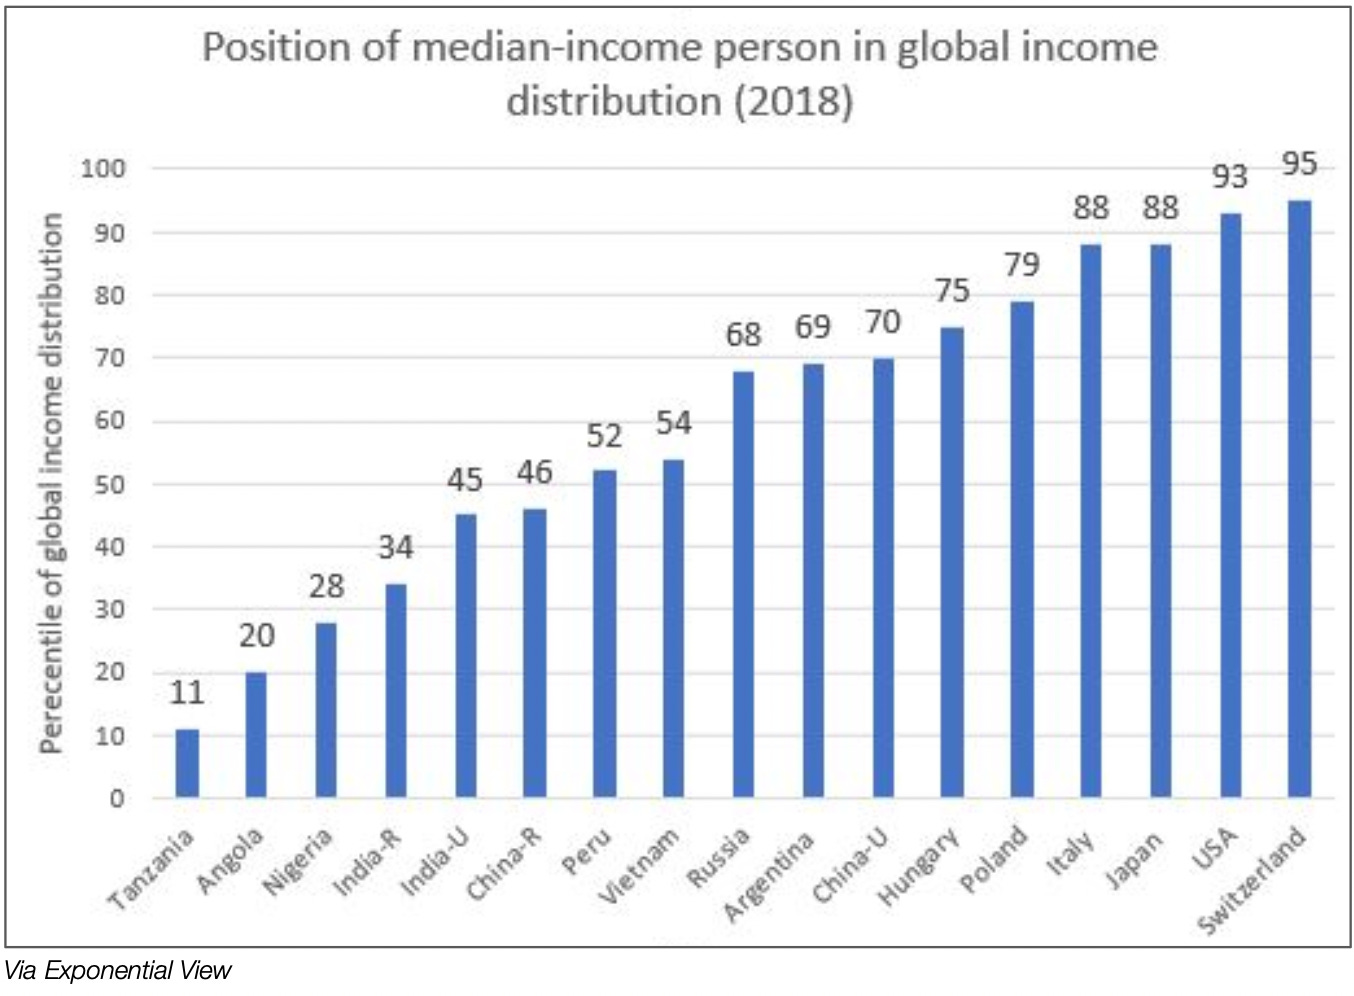
I visited Tanzania in August, and it had me thinking a great deal about wealth, infrastructure and development. I’ll pen some thoughts in due course. Data from Branko Milanovic shows that the median Tanzanian citizen would be amongst the poorest 11% on the planet. The population which best represents the global median is Palestine (West Bank or Gaza), El Salvador or Gabon. If you are of median income there, you sit roughly in the middle of humanity. The average American is richer than 7.2 billion humans.
A tale of two cities
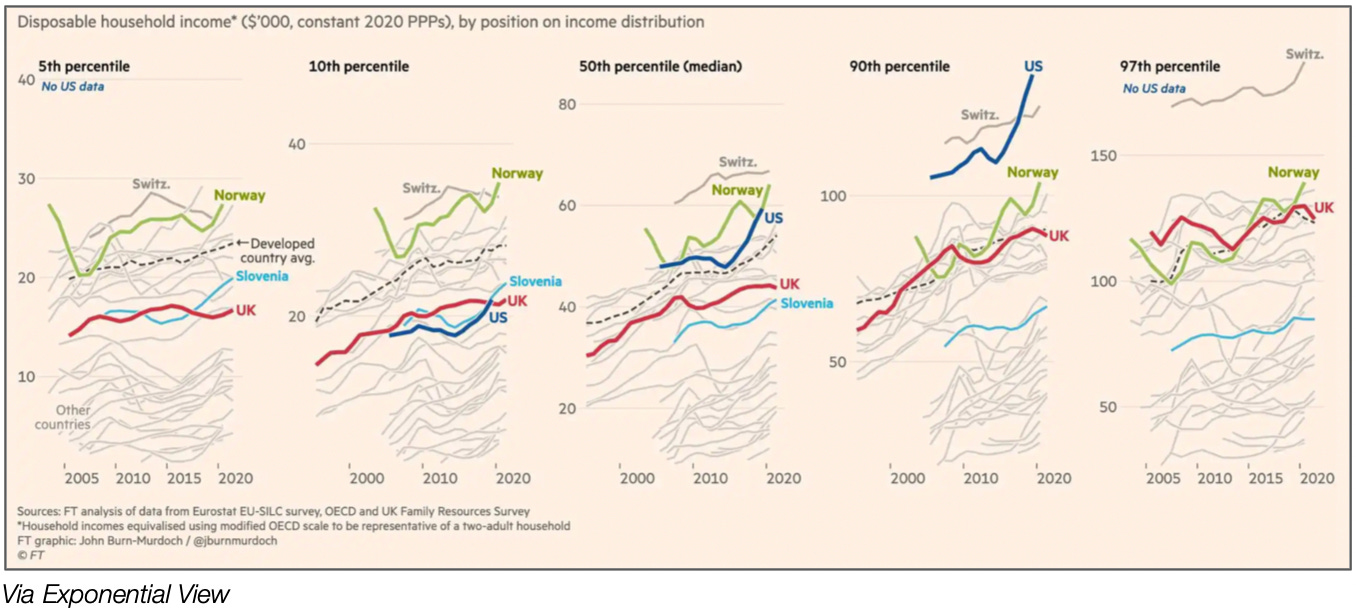
Inequality in the US and UK is so high, the Financial Times describes them as “poor societies with some very rich people.”
It highlights an absurd situation for Britain, so desperate for migrant labour.
While Britain’s top earners rank fifth, the average household ranks 12th and the poorest 5 percent rank 15th. Far from simply losing touch with their western European peers, last year the lowest-earning bracket of British households had a standard of living that was 20 per cent weaker than their counterparts in Slovenia.
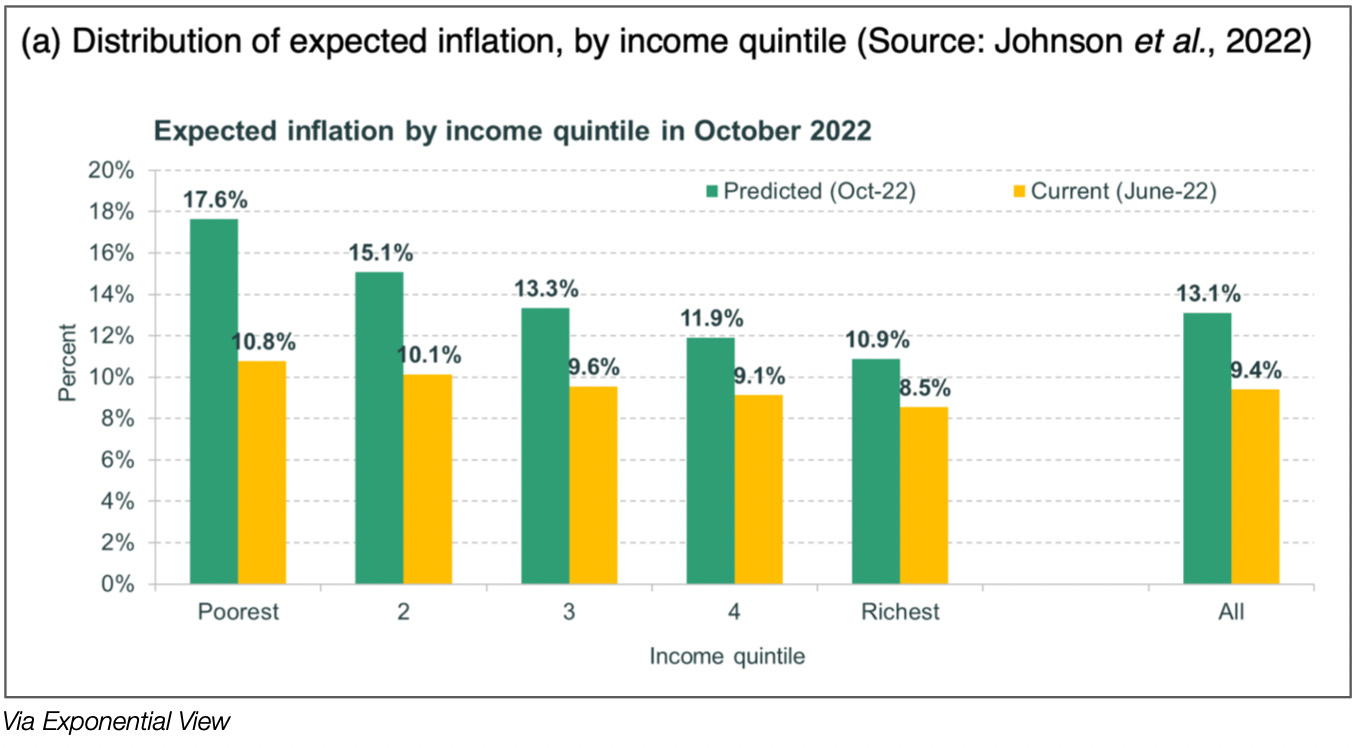
You’re gonna carry that weight
And it’s getting worse: the poor are significantly more affected by the current inflation spike than the rich.
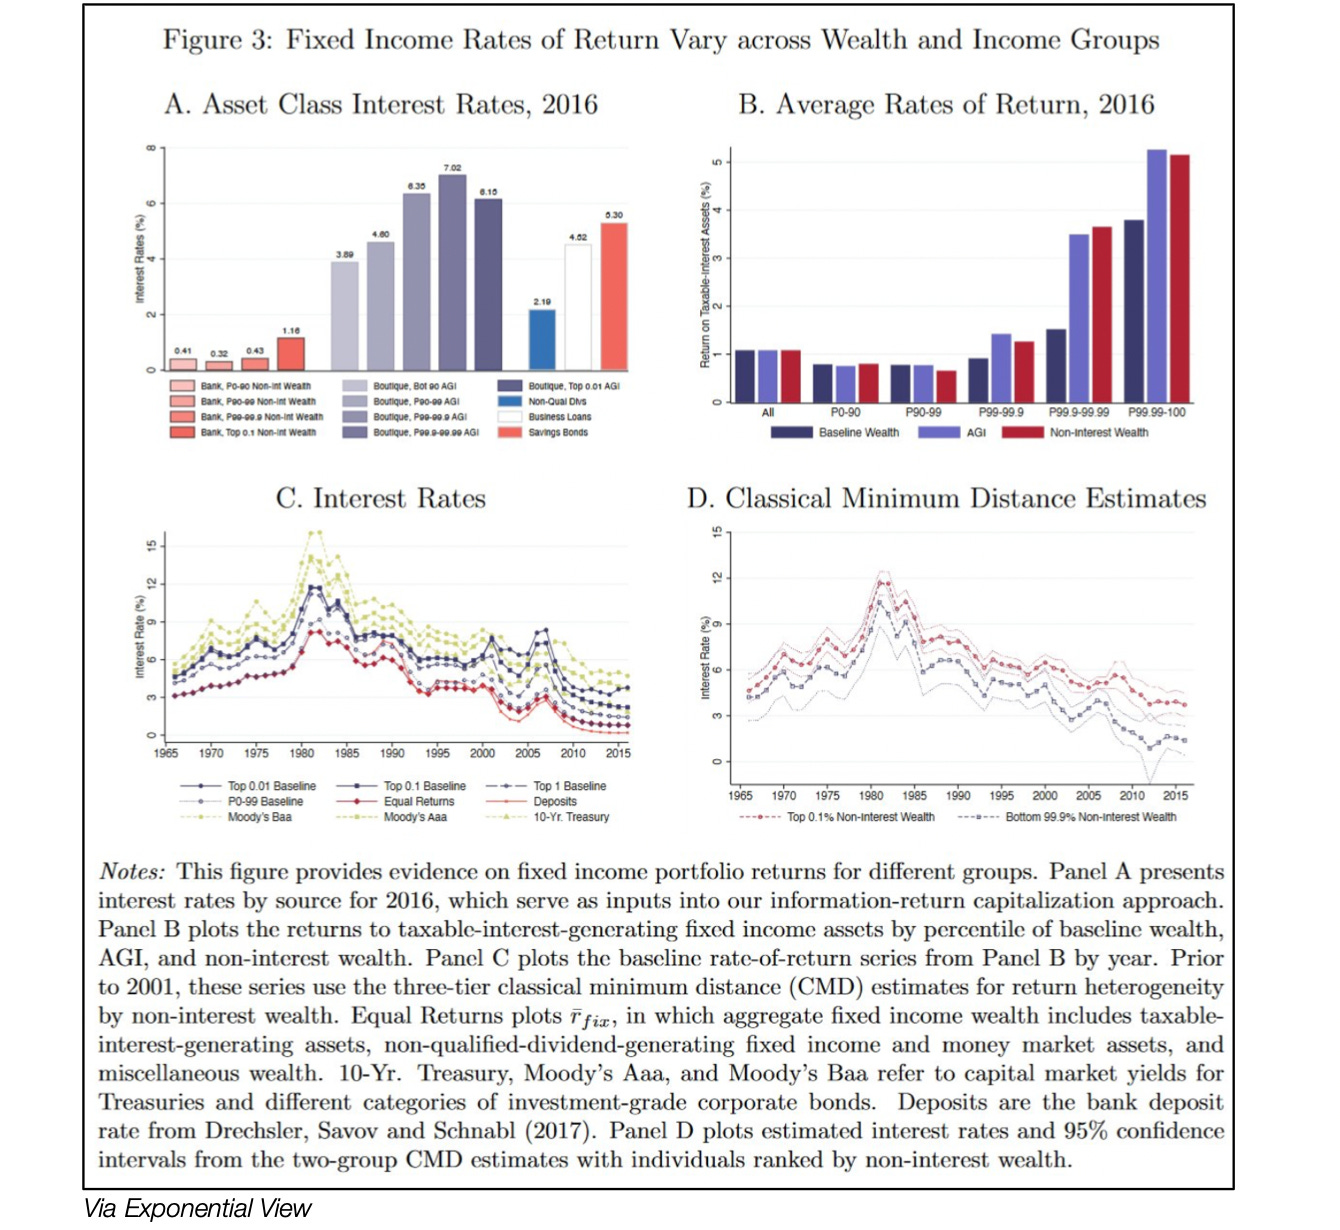
Dividends pay dividends
Ethan Mollick writes, about the US:
Adding to the inequality, the ultra-rich earn much more on their wealth than even the rest of the top 1%. For example, interest income for the top 1% in 2016 was 1%, for the top .01%, it was 3.8%. The ultra-rich have exclusive access to some investment opportunities & classes.
WEDNESDAY POLL
Source: HBR
In the previous edition of Charts of the Week, we asked how many atoms it takes to encode the human genome. 32% of readers selected the correct answer: 204 billion.
