
🔮 The state of the AI economy
We’ve reconstructed the AI economy from the bottom up
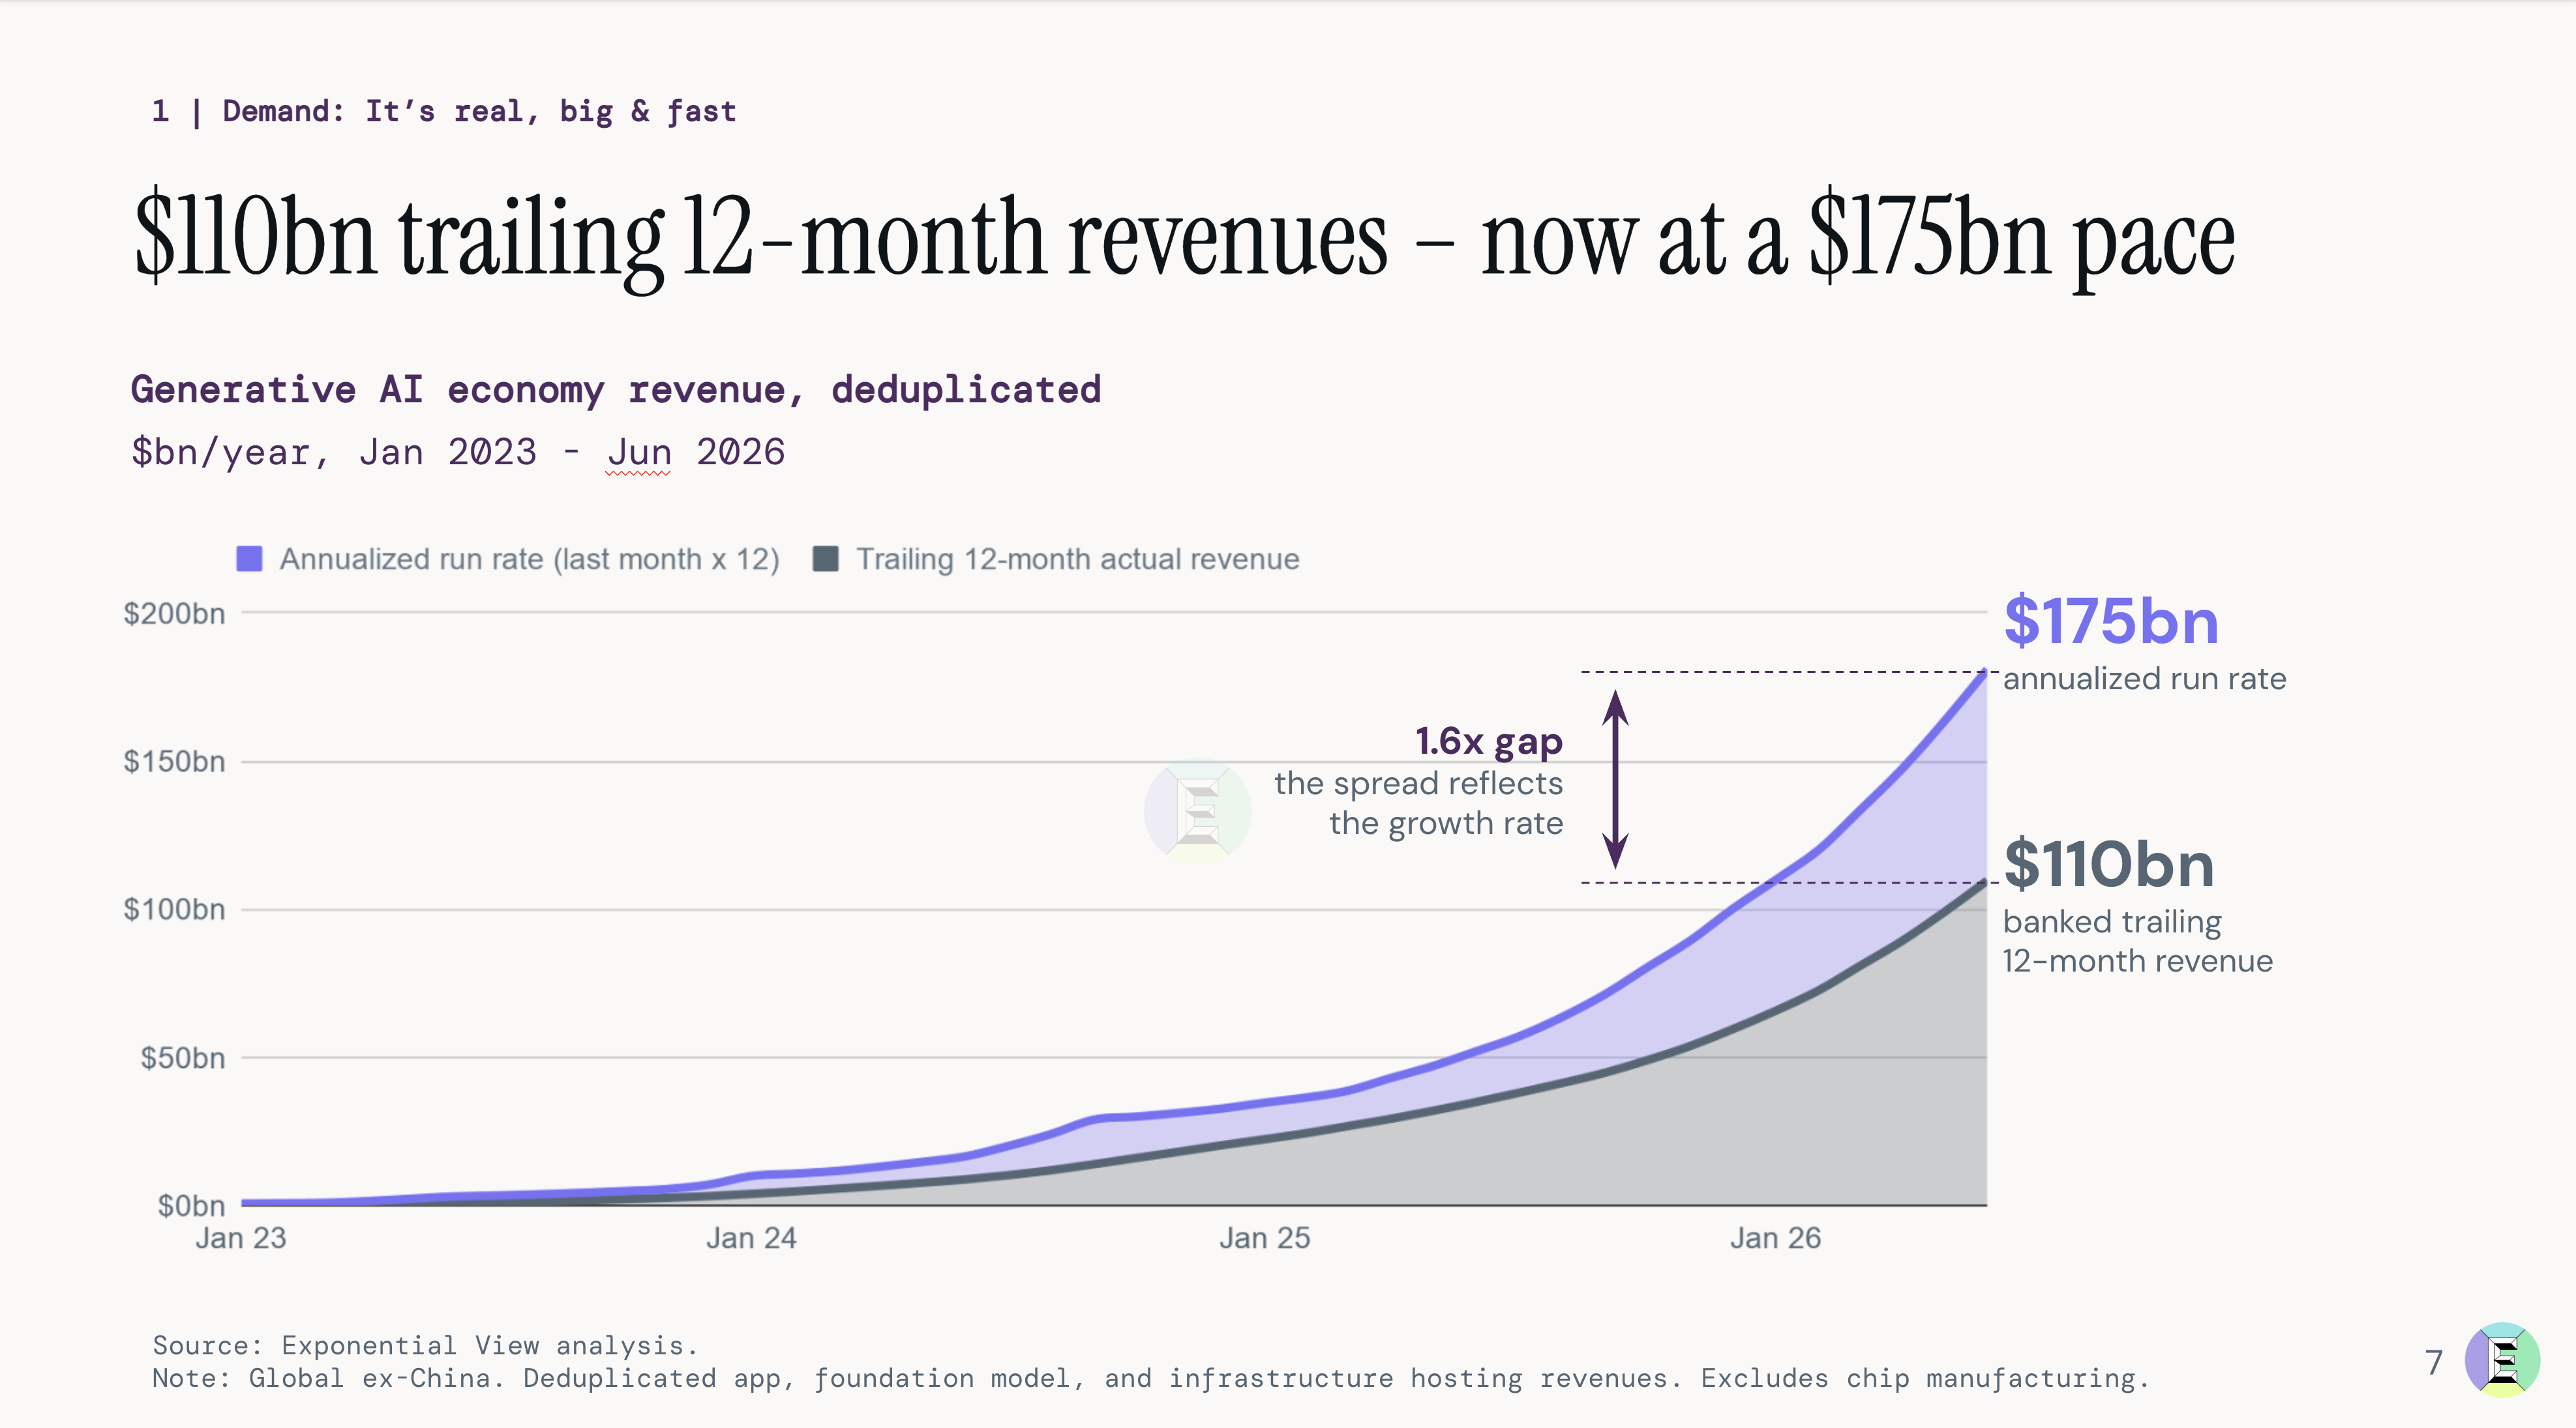
The generative AI economy has generated $110 billion in sales over the past 12 months. It is growing fast. On an annualized basis, the revenue run rate exceeds $175 billion.
These numbers took us several months to construct, and as far as we know, it’s the first bottom-up, deduplicated measure of consumer and enterprise AI spending across the full stack. We are releasing this research today in our first The State of the AI Economy report.
The supply side of the AI market is well-understood. The picks and shovel suppliers, the computer chips, the memory, the power transformers, the cooling, all of the components of AI data centers are largely public companies. We get a sense of what is being spent on the buildout through their disclosures, sales and forward order books.
But understanding the demand side is much harder. And this is what we’ve spent the last few months tackling. We built a proprietary AI economy model that looks at total AI spend, whether enterprise or consumer, to answer the hardest questions of the AI wave:
How big is the market really?
Are the revenues growing?
How far do the revenues go to cover the investment expense?
What happens to the economics in the future as token prices fall and the quality of those tokens improves?
Before we get into the report, we think it’s important to break down how we did this work.
THE METHODOLOGY
How we count the demand side
One of our central design choices was not to count the same thing twice. We report the dollar spent by an end customer. So if you spend one dollar with Anthropic for Claude and Anthropic spends 50 cents with Amazon to serve it, we track both figures internally, but we will report it as our de-duplicated number: one dollar. This avoids double-counting the value that flows through the supply chain.
This isn’t straightforward. While it’s easy to count the supply side, the demand side is trickier to entangle. Much of the revenue flowing into AI comes from privately held companies such as OpenAI, Anthropic, Cursor, ElevenLabs, and hundreds of others. They don’t legally need to disclose anything.
The remainder flows to the big hyperscalers that serve these models: Amazon, Google, and Microsoft. While they are public, they don’t consistently disclose their AI segment revenues.
To shed light on this, we examine public statements from hyperscalers and neoclouds, their suppliers, and their customers, using only high-confidence, detailed facts to inform our modeling. We also look at well-reported leaks and self-reports, to which we assign a confidence score.
The result is an item-by-item financial model for the largest contributing companies and business units. Each model is effectively a deconstructed financial plan, a P&L, balance sheet, and cash flow, and these are triangulated against other external sources and internal consistency checks. This makes our numbers auditable. We can identify which data point, with which confidence weighting, contributed to any given estimate.
What we don’t count
We don’t include internal AI uplift, which is how much recommendation systems have improved, increasing ad revenue at Meta or Google. We do have models for those, but we’re not reporting them here.
Nor do we consider efficiency savings that the bigger tech companies might realize with their internal tools. We’re not tracking that yet.
We don’t include professional services and systems integration. When a Fortune 500 company spends or invests in AI, only a portion of that spend will go to an AI company. It won’t represent the full extent of their commitment, because a large part of it will be paying professional services to support the implementation.
We have got models for revenues in China, but this v1 of our report doesn’t include Chinese data yet.
THE TOP LINE
Are the revenues real?
Over the past 12 months, the AI ecosystem generated $110 billion in revenue when you remove double-counting. The growth rate is healthy. Annualizing the most recent month’s revenues indicates a $175 billion revenue run rate.
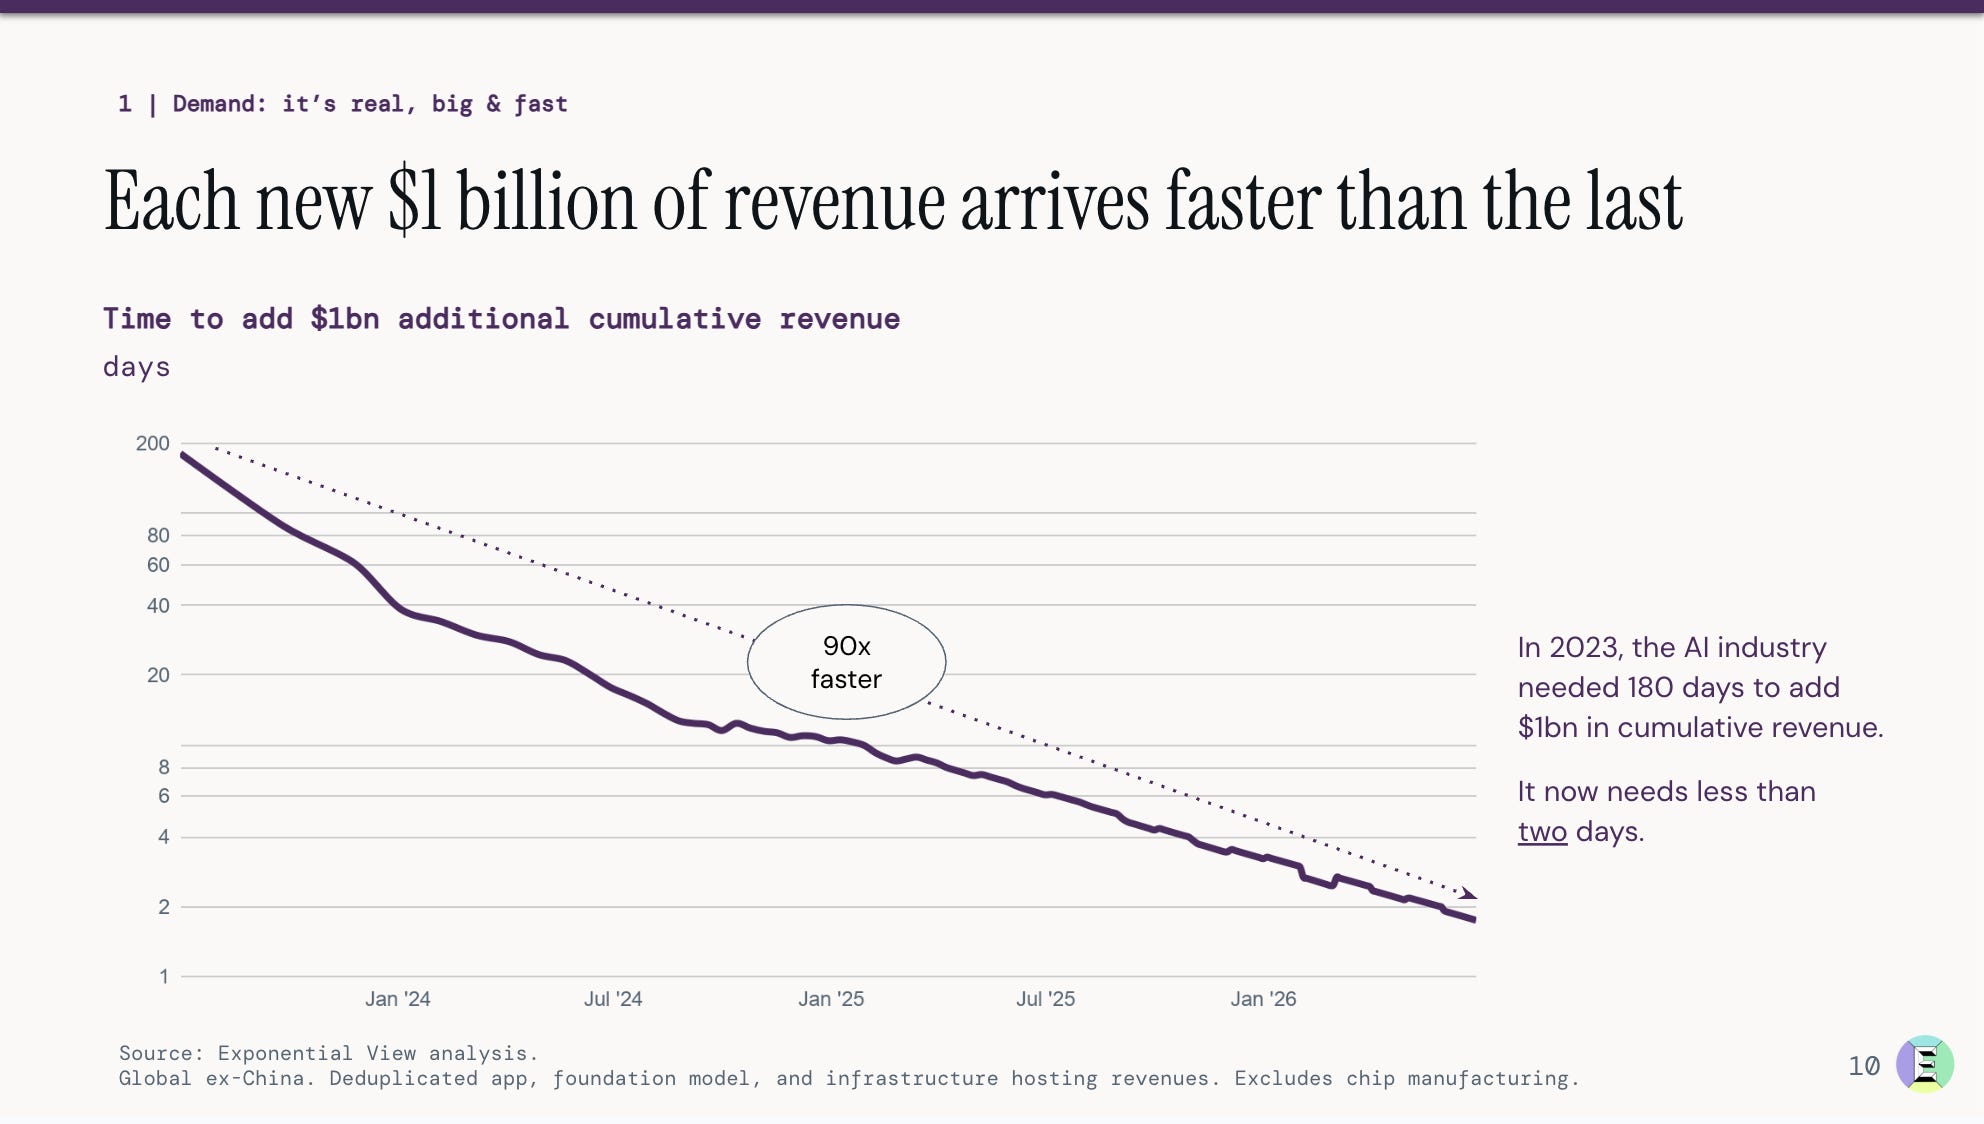
These revenues are growing faster than previous IT-oriented waves, roughly three times more rapidly than the mobile or Internet waves.
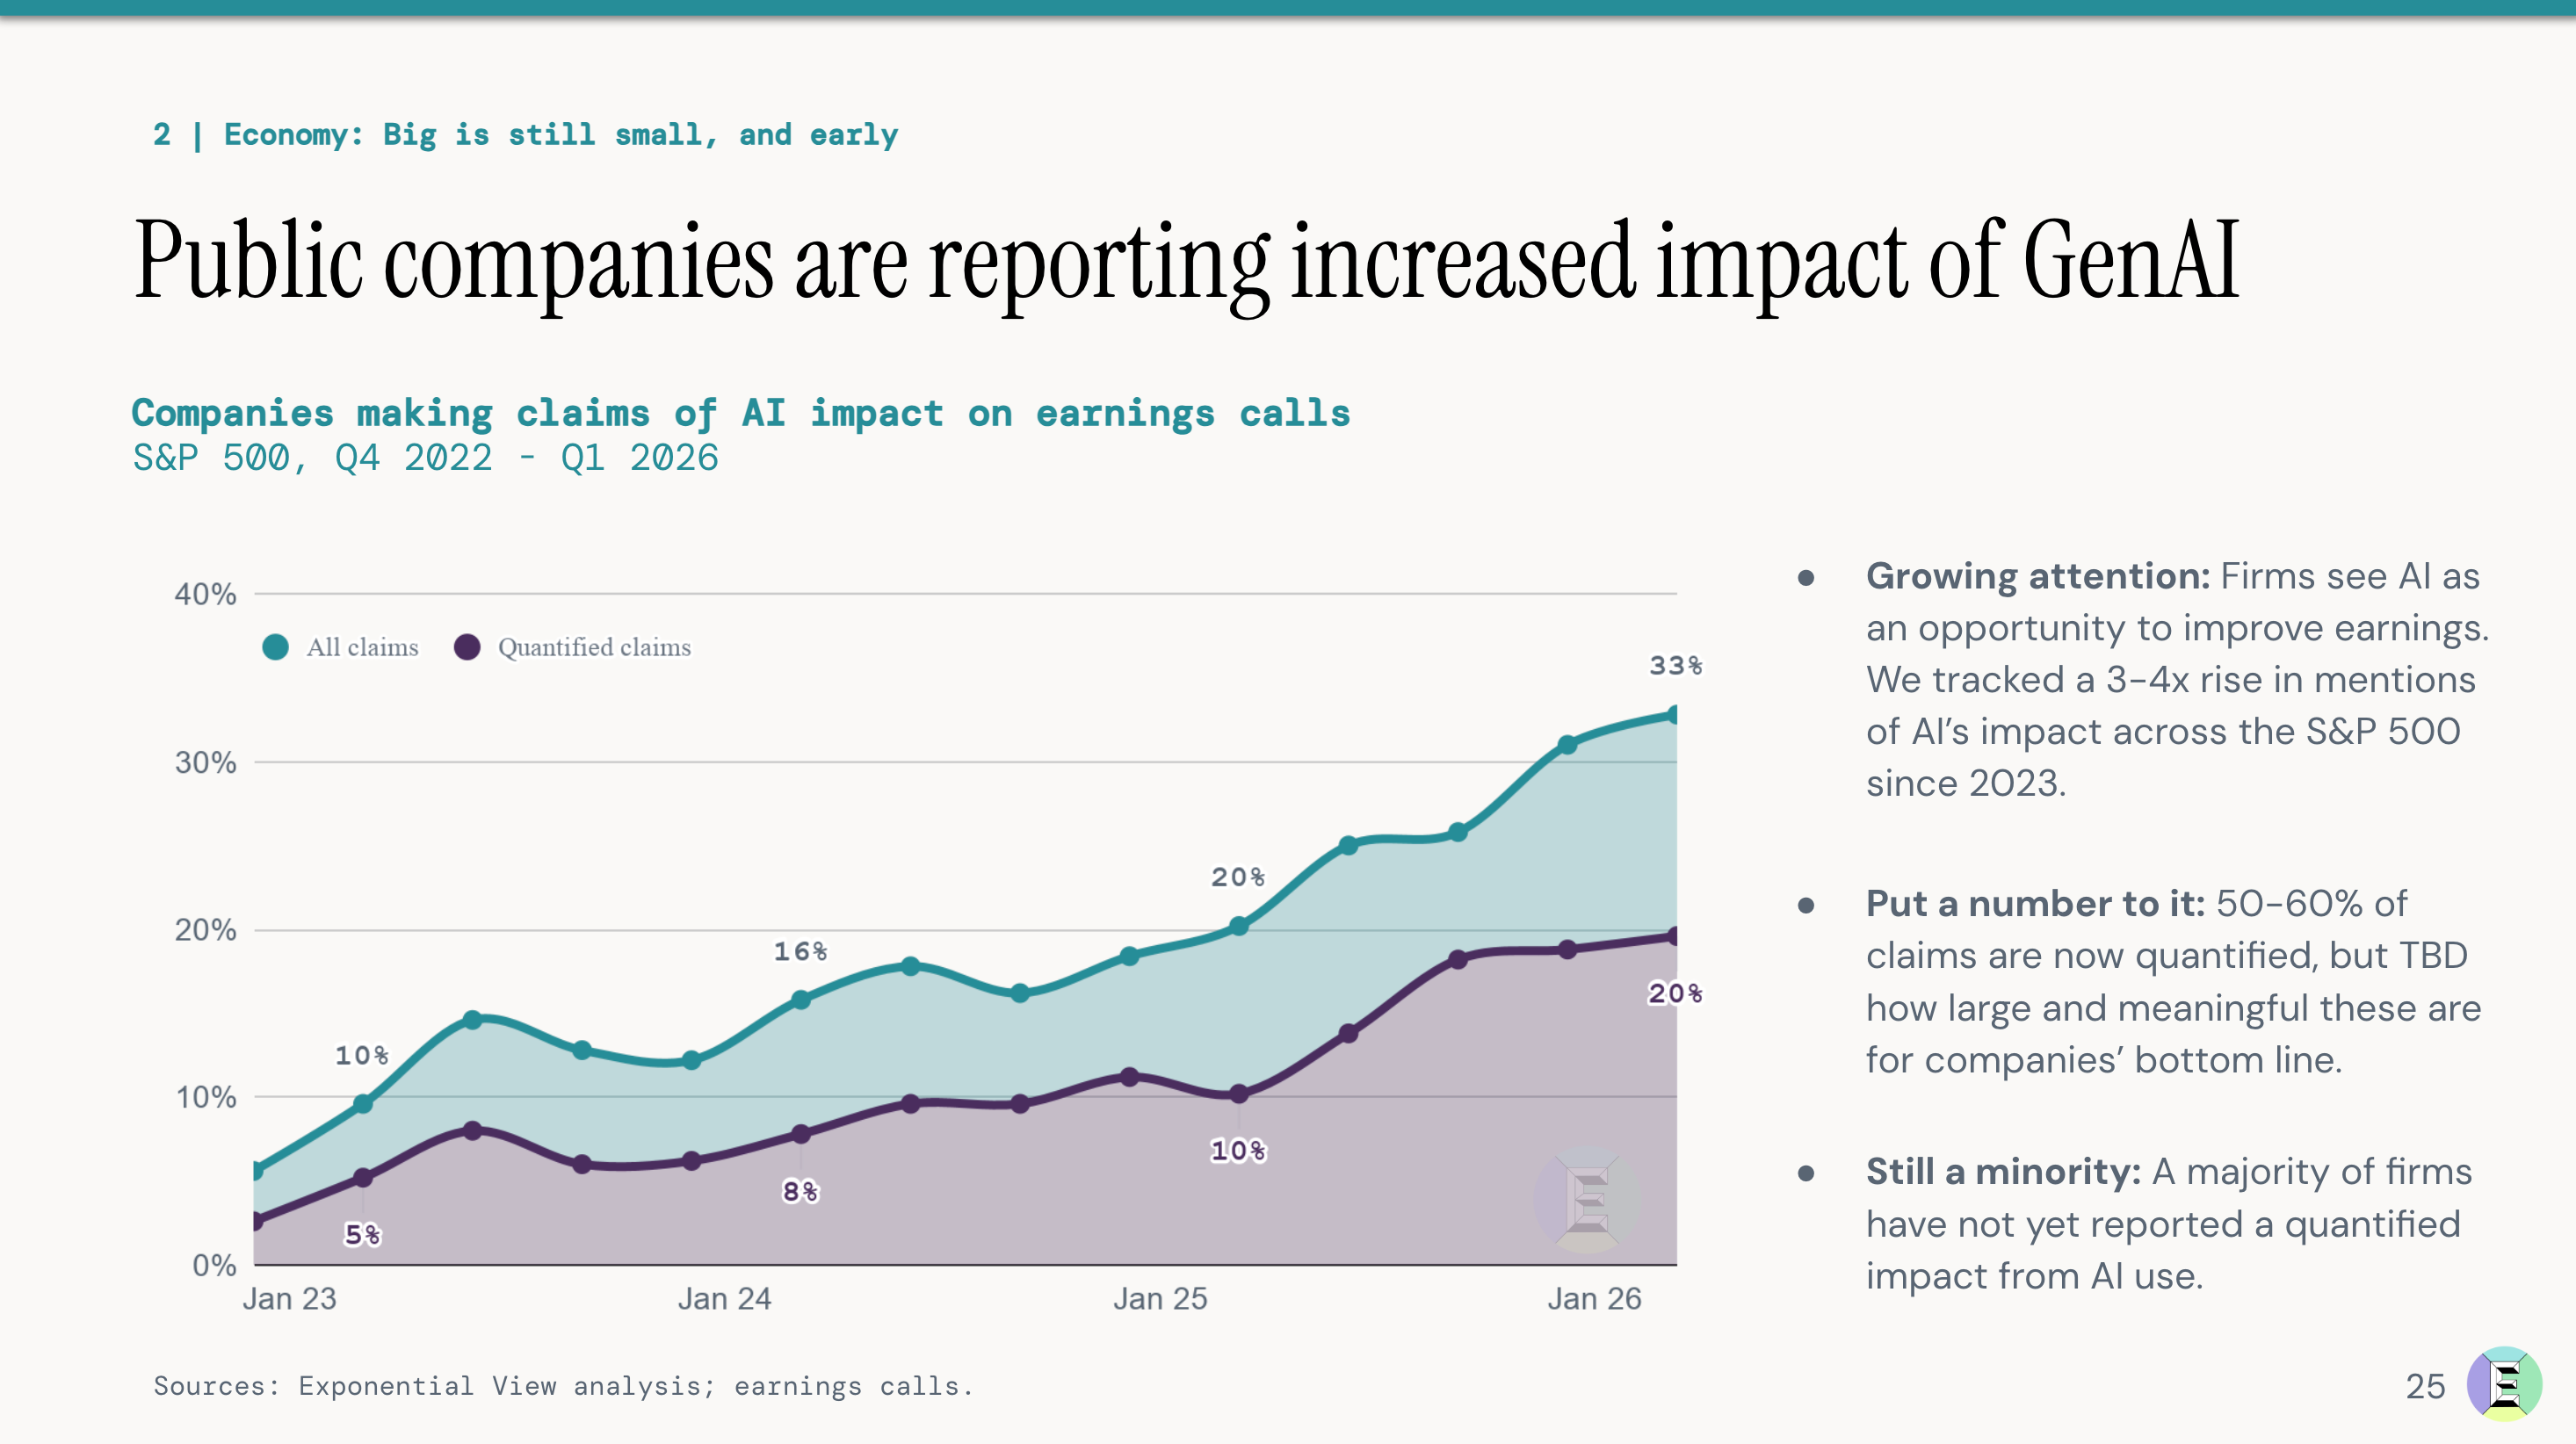
While many companies have moved beyond occasional pilots, they are still in the early stages of scaling and deepening. In conversations Azeem has had with senior execs across a range of industries in Europe and the US (from industrials to insurance, from finance to pharma), the consistent message is that they intend to invest more heavily in AI in the coming years. Companies are also becoming more vocal about the impact of AI on earnings calls, with the caveat that half of the surveyed CEOs believe their jobs depend on getting AI right.
Can AI revenues pay the GPU bill?
The next question we wanted to track is whether AI revenues can cover the capital investment that’s required to build the infrastructure. Our model separates AI-oriented CapEx from ordinary CapEx across the major hyperscalers and neoclouds, the specialist AI cloud providers. This adjustment is important because hyperscalers were already spending around $120 billion annually1 on CapEx before ChatGPT.
We capture the additional investment in AI infrastructure, then depreciate compute assets over 6 years and other infrastructure over 14 years. Our modeling shows that revenues attributable to hyperscalers just about clear the depreciation expense.
Six years is defensible. That longer useful life reflects two things. One, demand still exceeds available AI compute; and two, operators are getting better at managing GPU fleets. Both help. The second alone is enough to justify a longer economic life.
What is the future of the token?
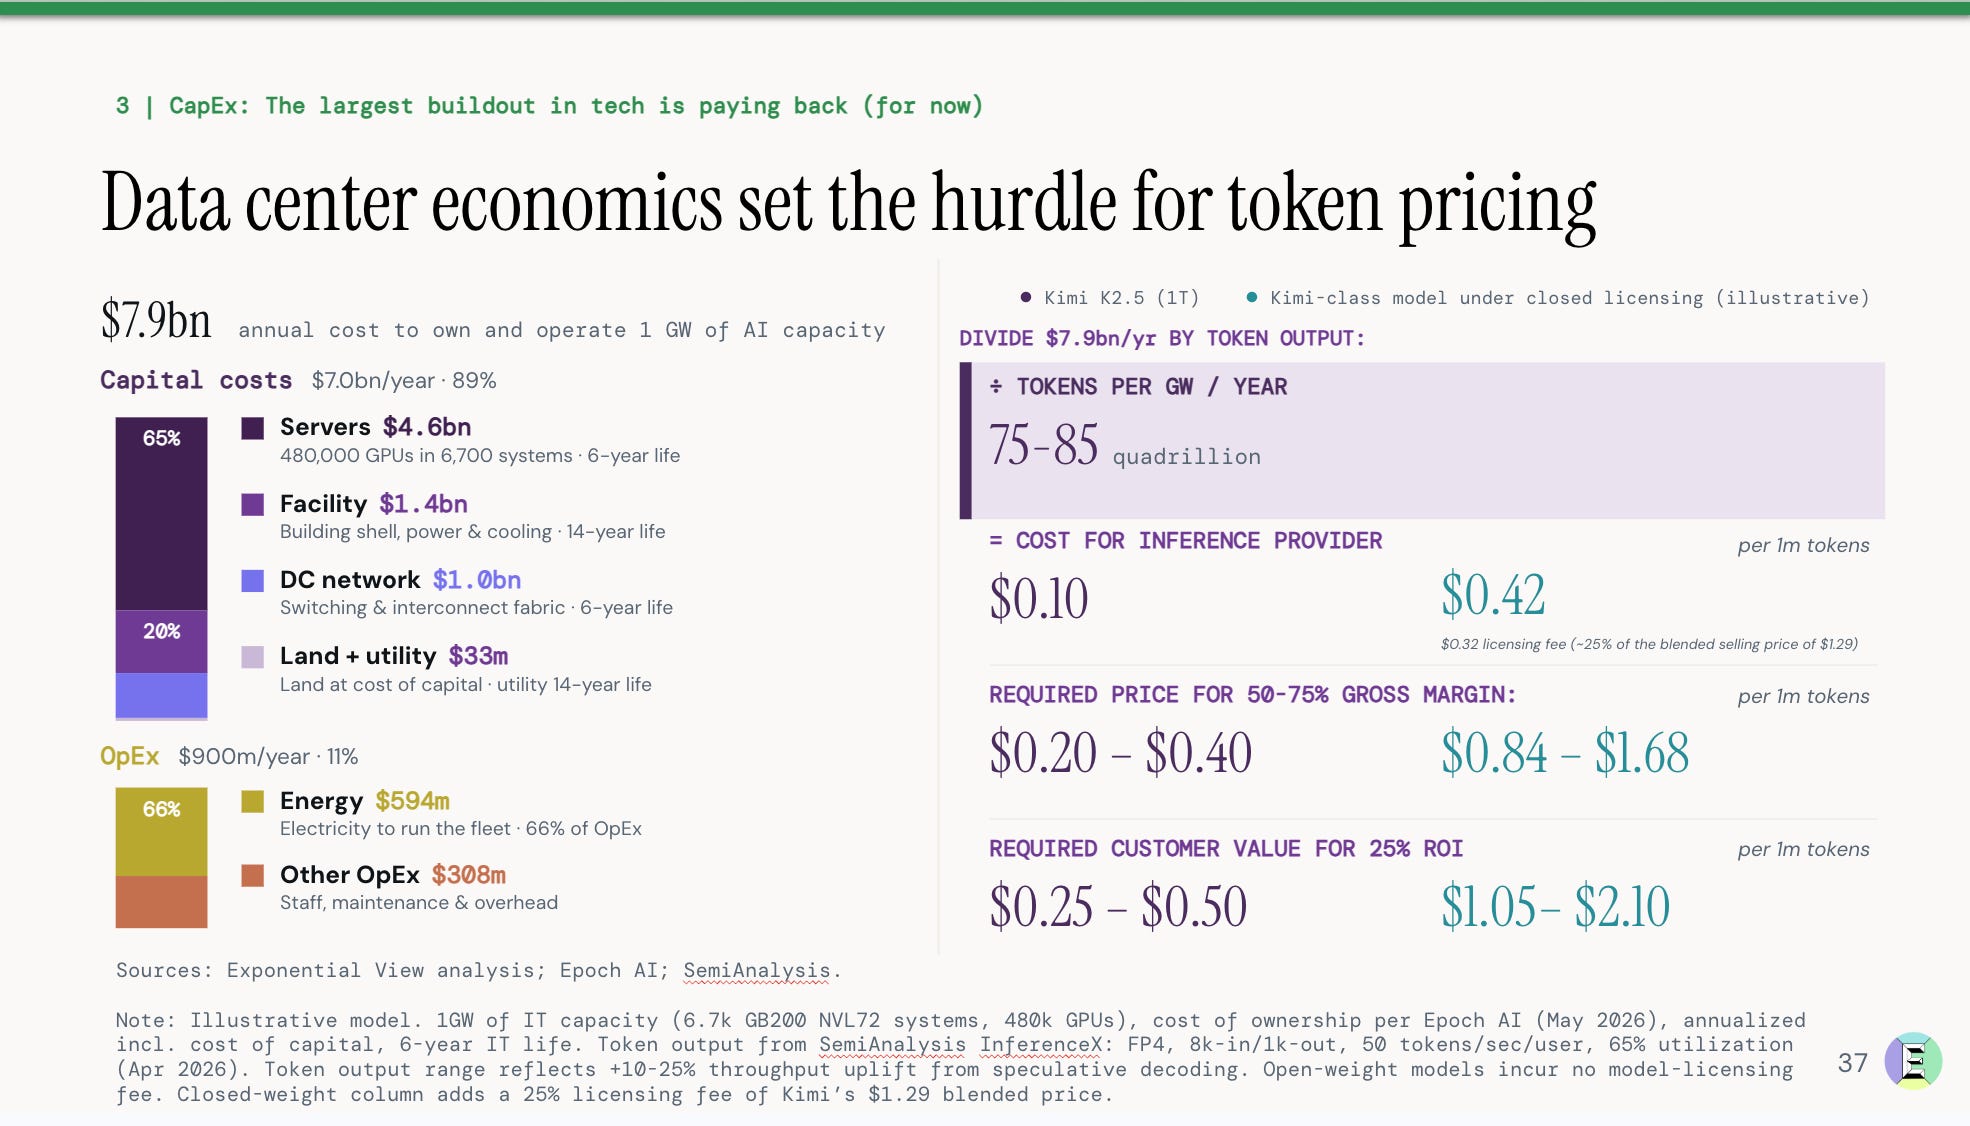
We also examine how market size changes as token prices fall. The elasticity of demand shows that lower prices are met with increased spending. We estimate that across providers, every 10% price cut leads to 12-18% more tokens in use, so the total spend still rises.
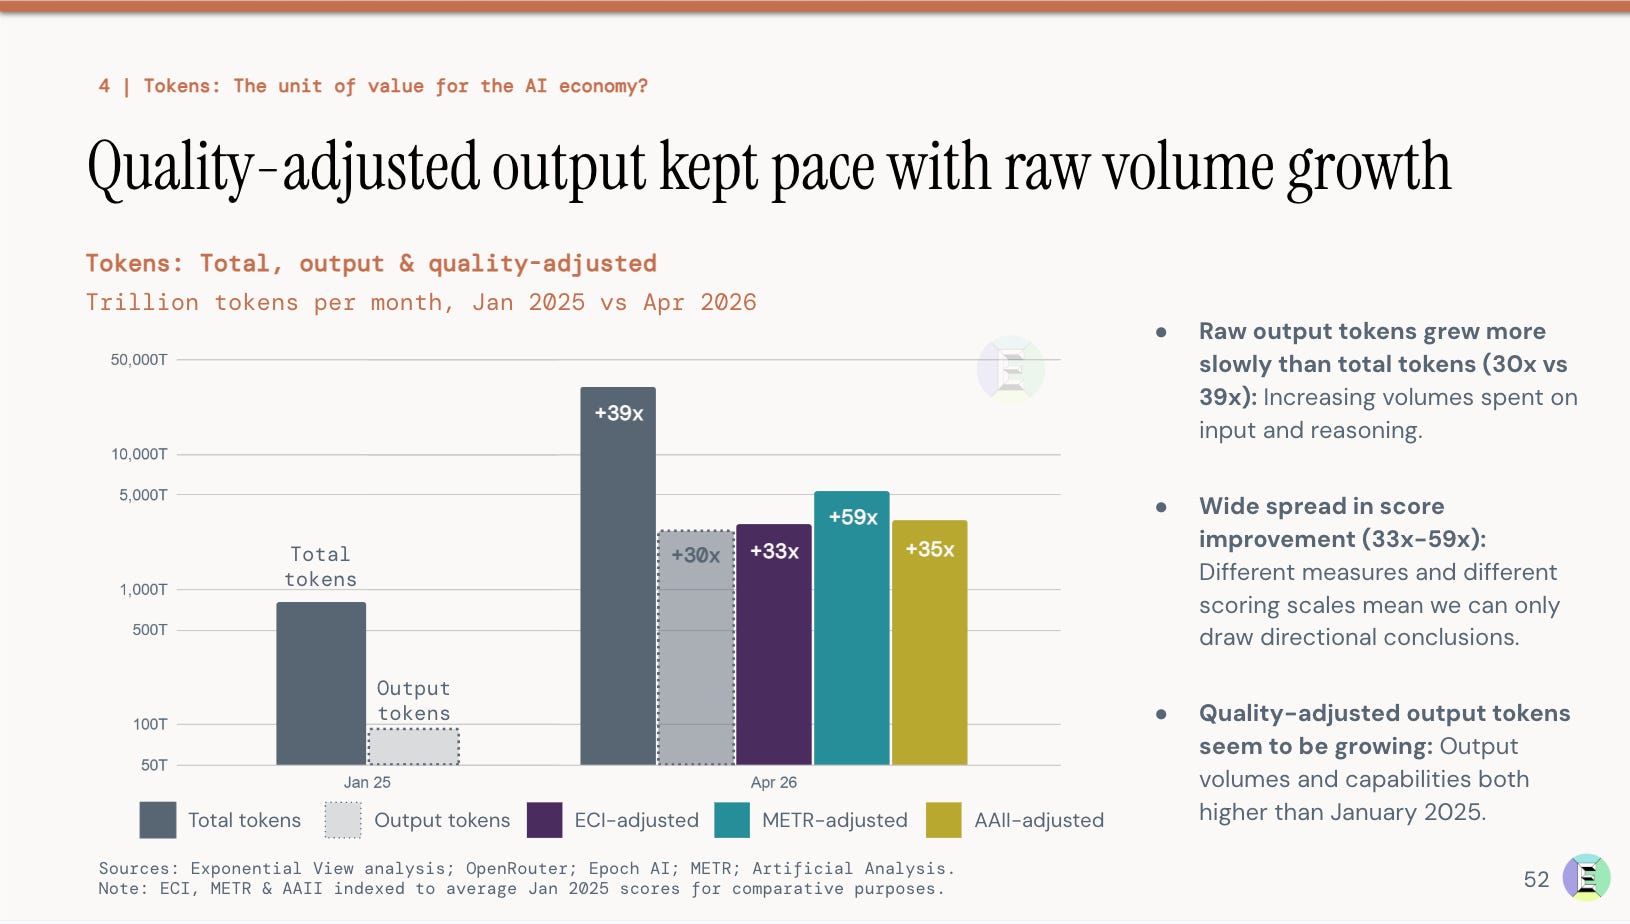
We suggest that although a token is a useful billing metric, it is still not the unit of value we need to measure the economic value of intelligence circulating through the sector. Quality‑adjusted output tokens give us a better “intelligence quotient” for the AI economy by combining how many tokens are produced, how many of them are actually user‑visible outputs, and how capable the underlying models are.
What else is in the report
The report also covers:
What AI demand has done to the US power industry and how power efficiency is changing,
What is happening to token costs, and how consumption-based billing may expand the market,
Four scenarios for how fast AI demand could grow under different price and capability trajectories.
This is v1, and we’d love your constructive feedback on what to improve and how you can help. Email us at aieconomy [at] exponentialview.co
Google, Microsoft and Amazon (whose spending included logistics investments). This number excludes Meta.
The usable unit of value slide is the best one - question remains on what will be left for the rest of us.
Act as System Integrators? Harness Designers?
Several questions to be discovered and a lot to be developed towards the downstream.
cheers!
rogério
A couple of comments here are circling the power question, so one angle from the infrastructure side.
In the State of the AI Economy deck, slide 36 carries the cost of consumed electricity: the $594m energy line, which is reasonable on its own. What it does not separately identify is the cost and lead time to make a GW of IT load actually available at the site. On-site power and cooling sit in the facility line, but utility-side interconnection, transmission, substations, queue timing, and fixed-capacity commitments appear only inside a $33m "land + utility" line, if at all.
That matters because large-load power is not purely usage-based. Demand charges, minimum-billing demand, and take-or-pay commitments keep much of the bill fixed even when utilization runs below plan. And slides 32-34 frame "headroom" as revenue after depreciation, not after OpEx, so energy is in the slide 36 unit cost but outside the "paying back" claim.
Slide 16's data center examples show both paths. Rainier in New Carlisle takes the grid route: a ~2.3 GW build phased over years, with a $150m+ transmission and 345kV substation buildout. xAI's Colossus took the other route, self-supplying ~1.2 GW of gas off-grid because the interconnection queue was too slow; per the SpaceX IPO filings it now runs ~1 GW of IT compute across three buildings, well past the chart's early-2025, single-building 300 MW marker.
Forward-looking, the swing on cost per token is less the marginal electricity price and more when, how, and under what fixed commitments a site gets powered.