
🔥 We checked. Again. Still no bubble.
A customer-led boom with a few fraying edges.
The verdict hasn’t changed. This is an AI boom, not a bubble. What has changed is the sheer scale.
Since we first ran this analysis in September last year, a lot has changed. Some 170 AI models have been released. The best now handle tasks four times as long as last year’s top performer. Usage has responded; quarterly token consumption has tripled.
The money has followed. The NASDAQ is up 20%; quarterly capex commitments have jumped 43% to $158 billion; and AI sector revenues have nearly doubled to $25 billion in Q1 of this year.
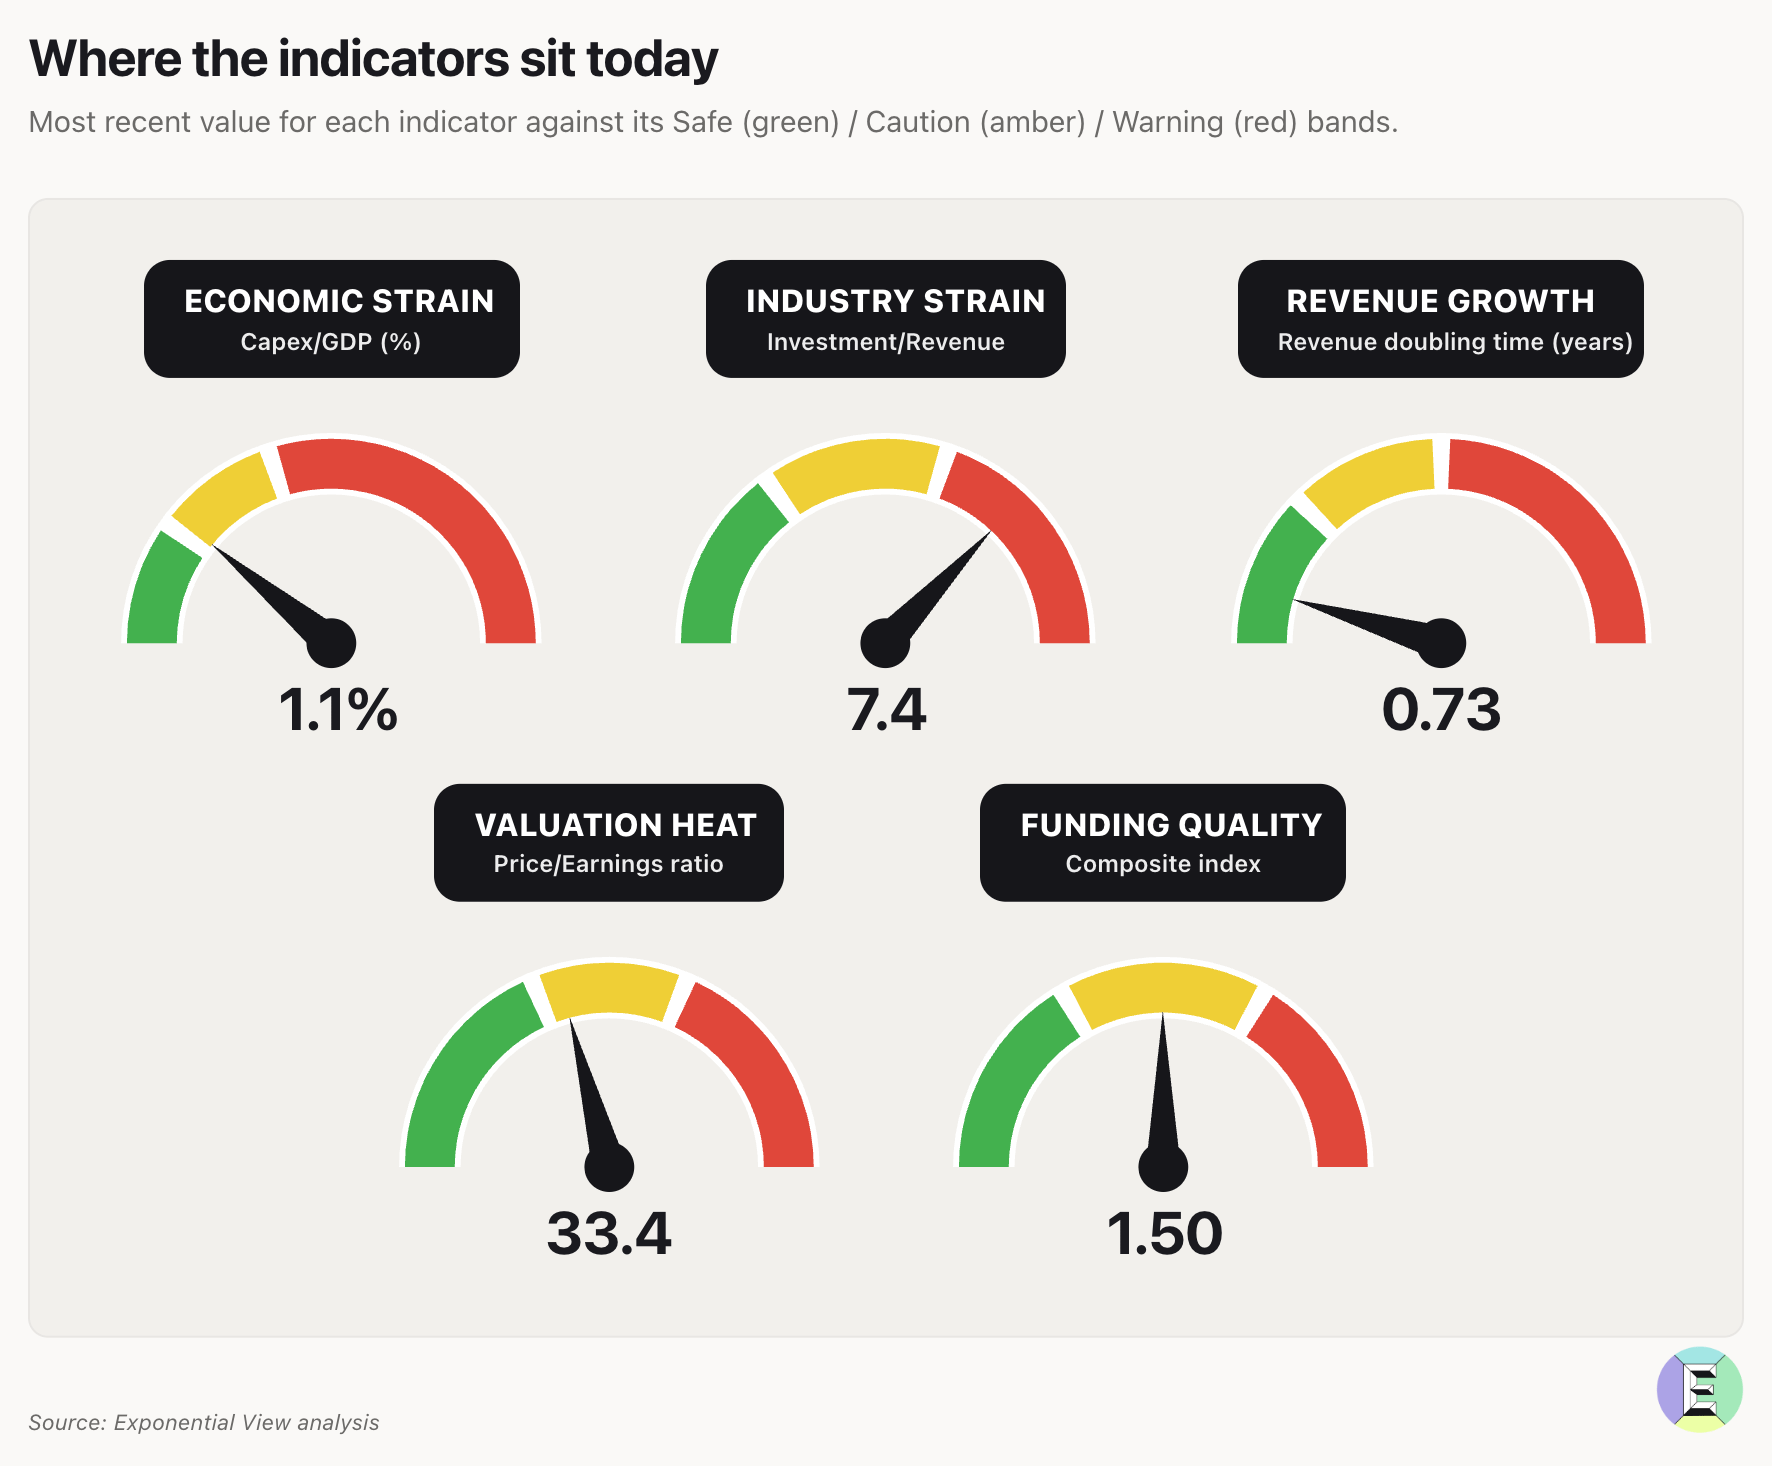
We’ve reviewed the data against our five empirical indicators, derived from analyzing 300 years of investment booms and busts. In our model, two indicators turning red indicate bubble conditions. Only one of these indicators is in the red; the rest range from green to amber.
Here is what these biomarkers show—and what it would take to change our minds.
Economic strain
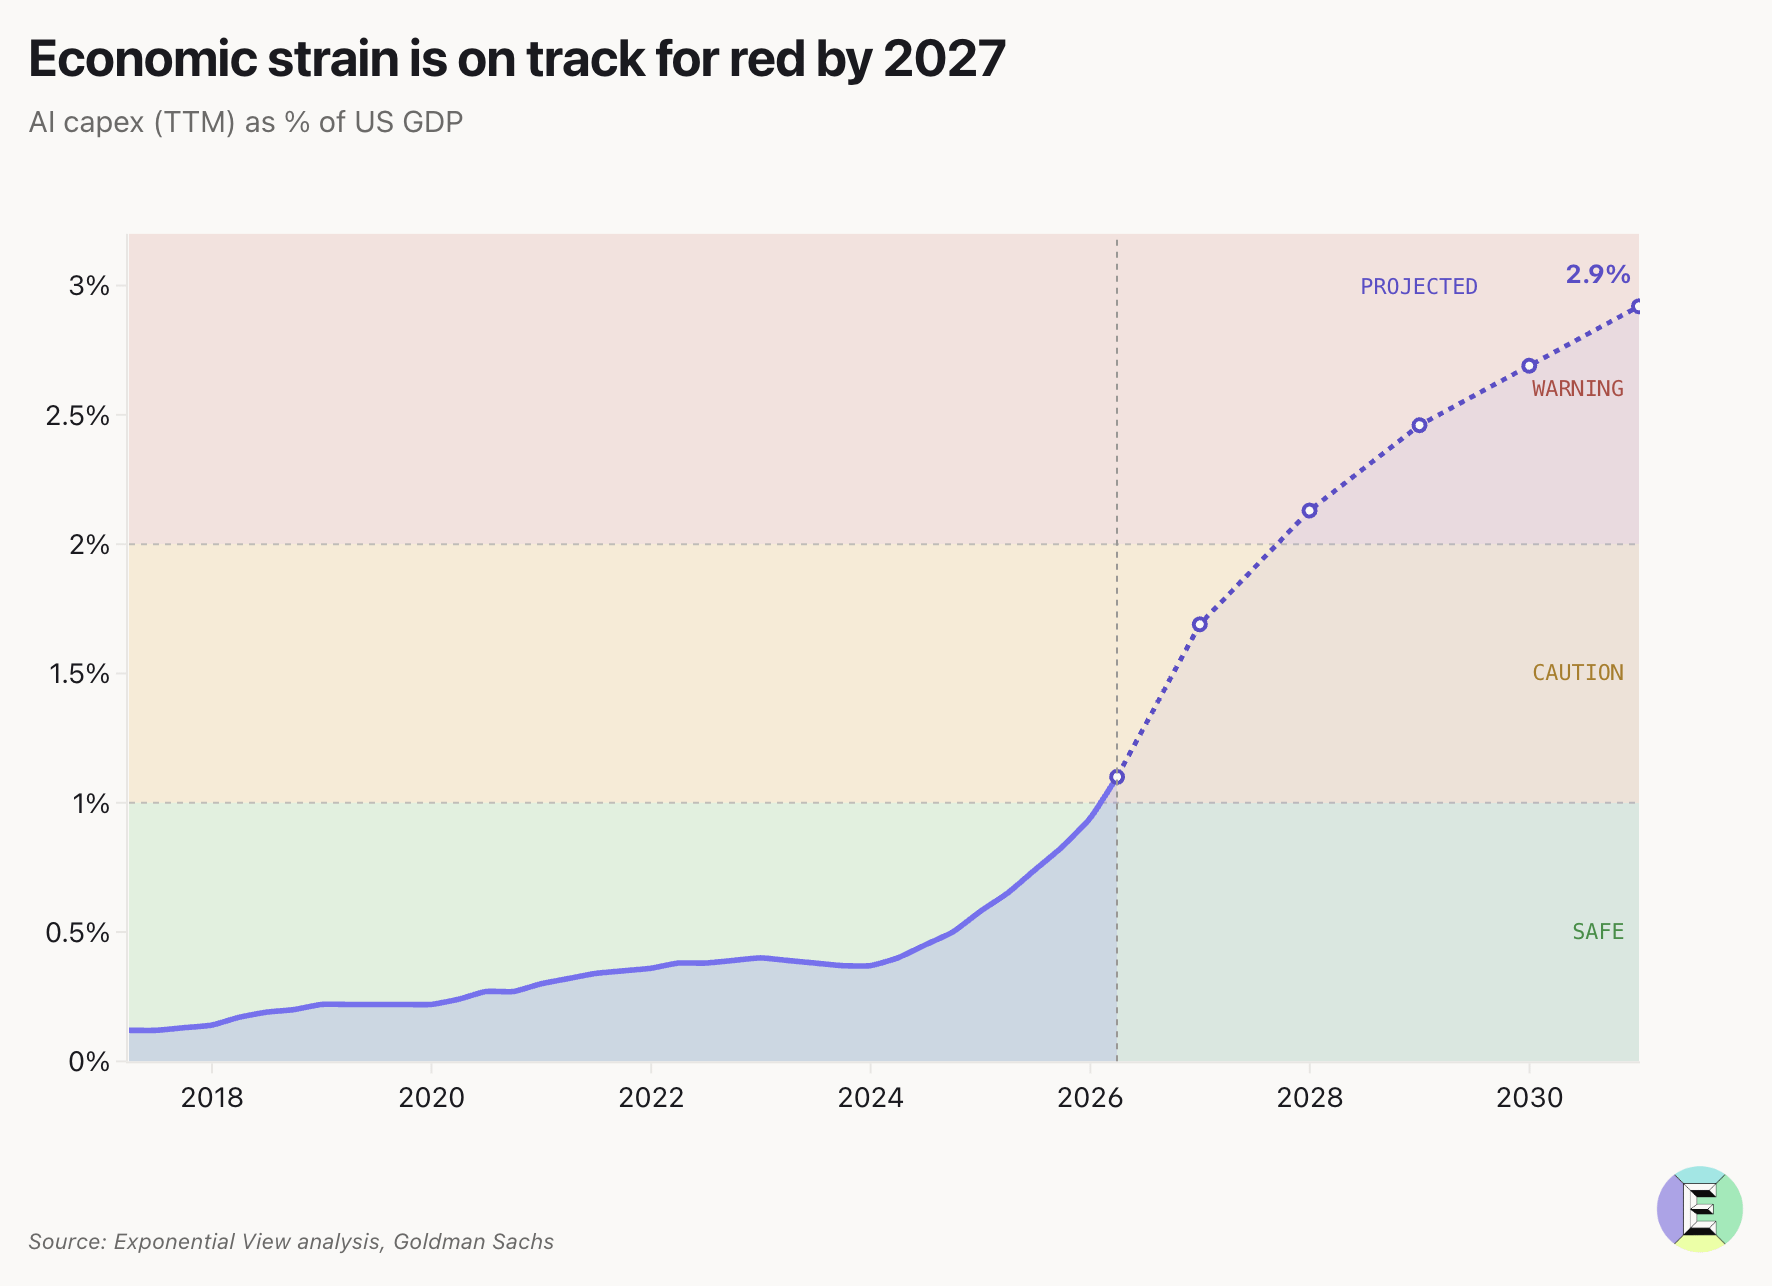
For economic strain, we look at the total capex into AI, which is predominantly in building out the data centers and power connectors, the chips and cooling, and other things that go in them. Here, we consider the US portion of that divided by US GDP.
Capex has risen dramatically since September 2025, from $110 billion to $157.7 billion per quarter. Neoclouds are now contributing meaningfully to this number, with their share of total capex rising from 12% to 18%.
This rise in capex has led to economic strain exceeding 1% of US GDP, marking the first time it has entered the amber zone. AI capex now matches the scale of the late-1990s telecom build-out at its peak. Goldman Sachs estimates that aggregate AI capex will approach $1 trillion dollars in 2027. If we assume about 70% of that is in the US, this would be the indicator into the red zone towards the end of 2027.
An important note on our methodology: we used trailing twelve-month numbers for both Capex and GDP to measure economic strain. When capex rises so quickly, this may attenuate the indicator. On a quarterly basis, it actually doesn’t change the prognosis much. Economic strain remains in the amber, closer to green for this quarter.
Industry Strain
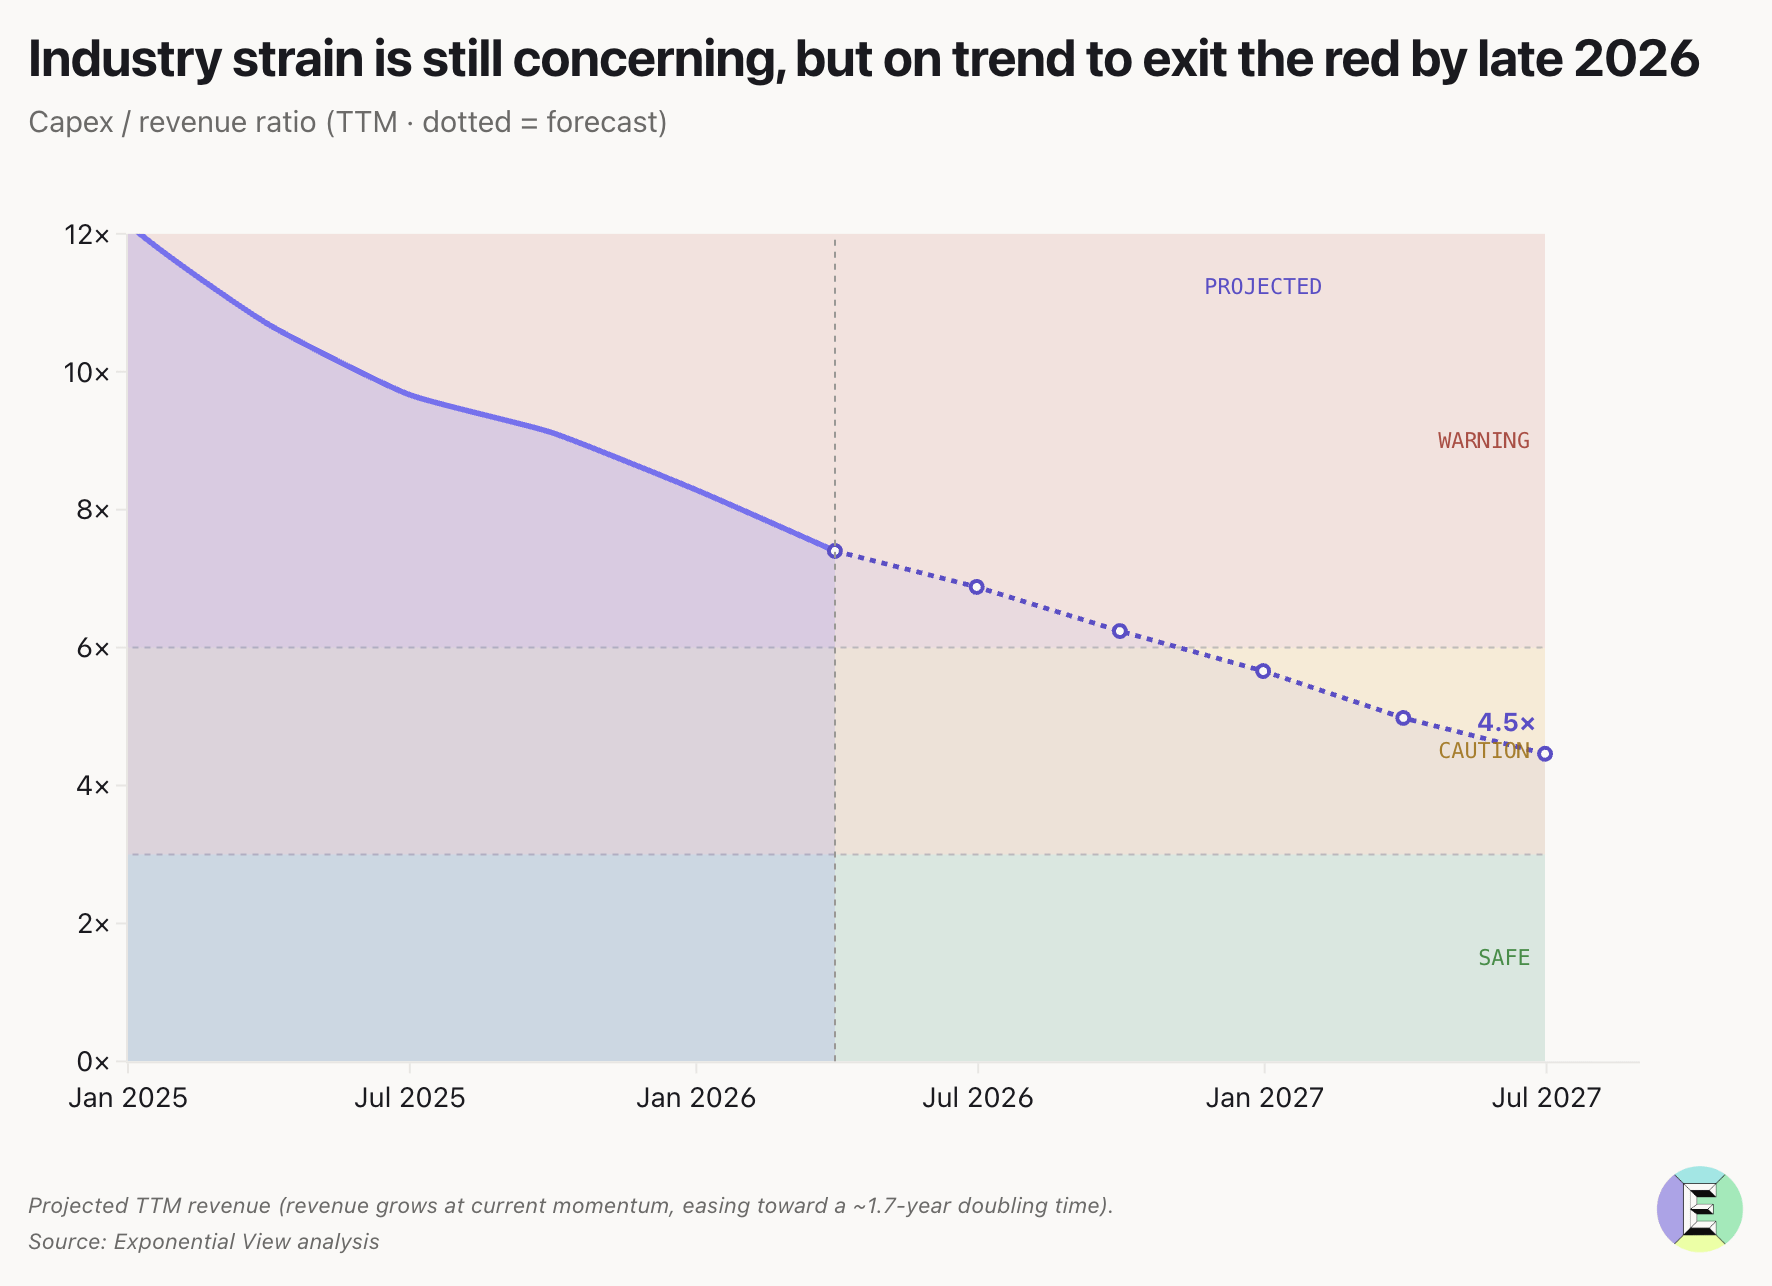
Industry strain assesses whether the industry can afford the investments it’s making. Investments always come ahead of revenue, but speculative build-outs that predate real revenues, as seen in the telecoms and dotcom bubbles, are deeply problematic.
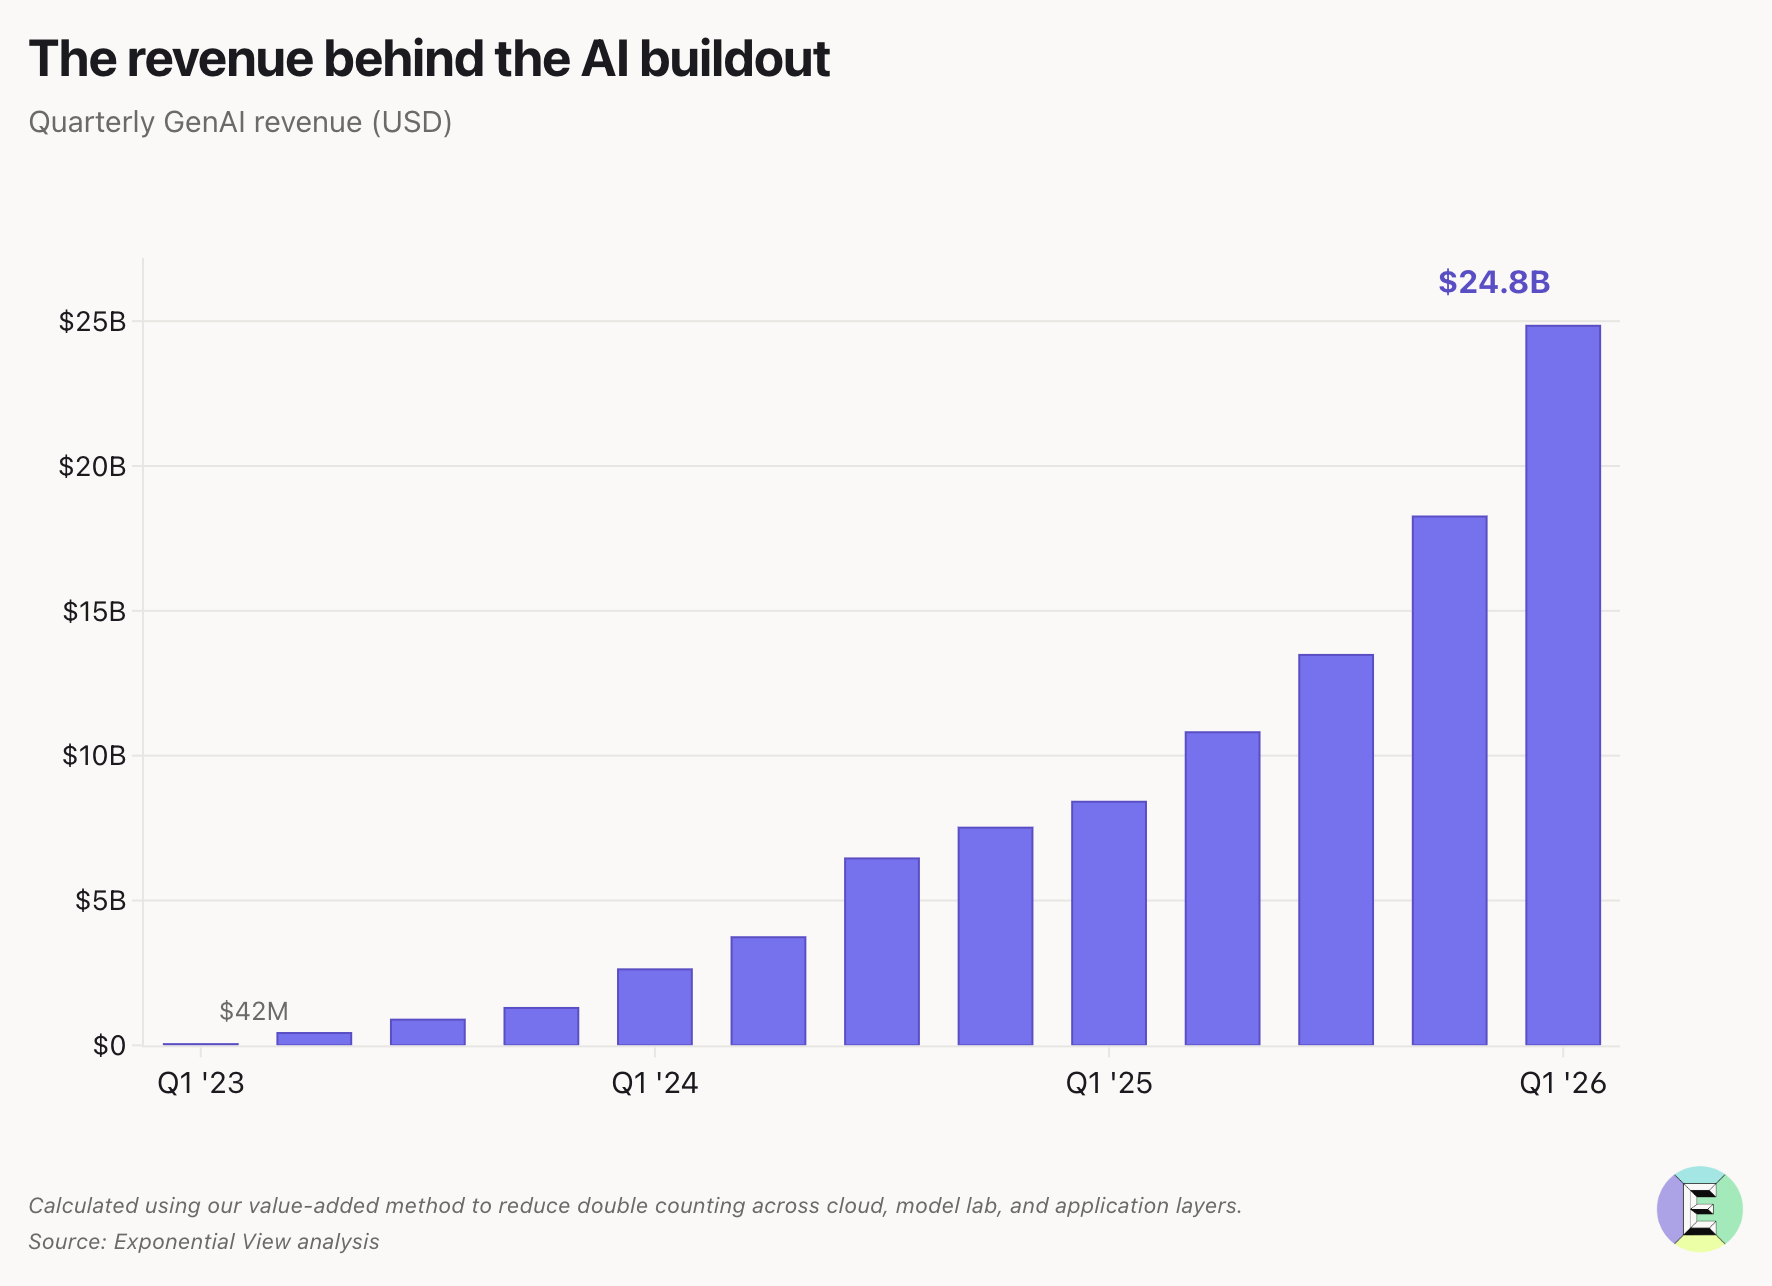
Quarterly revenues have roughly quintupled year on year: OpenAI from $1.7 billion to $6 billion, and Anthropic from $400 million to $4.8 billion. Based on our own bottom-up tracking of deduplicated sector revenue, we now put the figure at $25 billion a quarter, up from $13 billion in September.
One note on that number. Since the first piece, we’ve refined how we calculate sector revenue, moving to a more nuanced value-added approach that reduces double-counting across the cloud, model-lab, and application layers. Our original September figure for Q3 2025 was $25 billion; under the new method, that same quarter comes out at $13 billion.
This keeps industry strain in the red for now. But if revenue growth holds on trend – and capex forecasts don’t revise upward – it should exit the red by the end of the year.
Revenue Momentum
Growing revenues address industry strain. Ultimately, if real customer revenues accelerate fast enough, they will pay for the investments being made. We measure this through doubling time: how long it takes revenue to double.
As a market matures, you’d expect revenue growth to slow, and that was our assumption in both the original September work and the early-2026 update. We forecast a deceleration. That isn’t what happened.
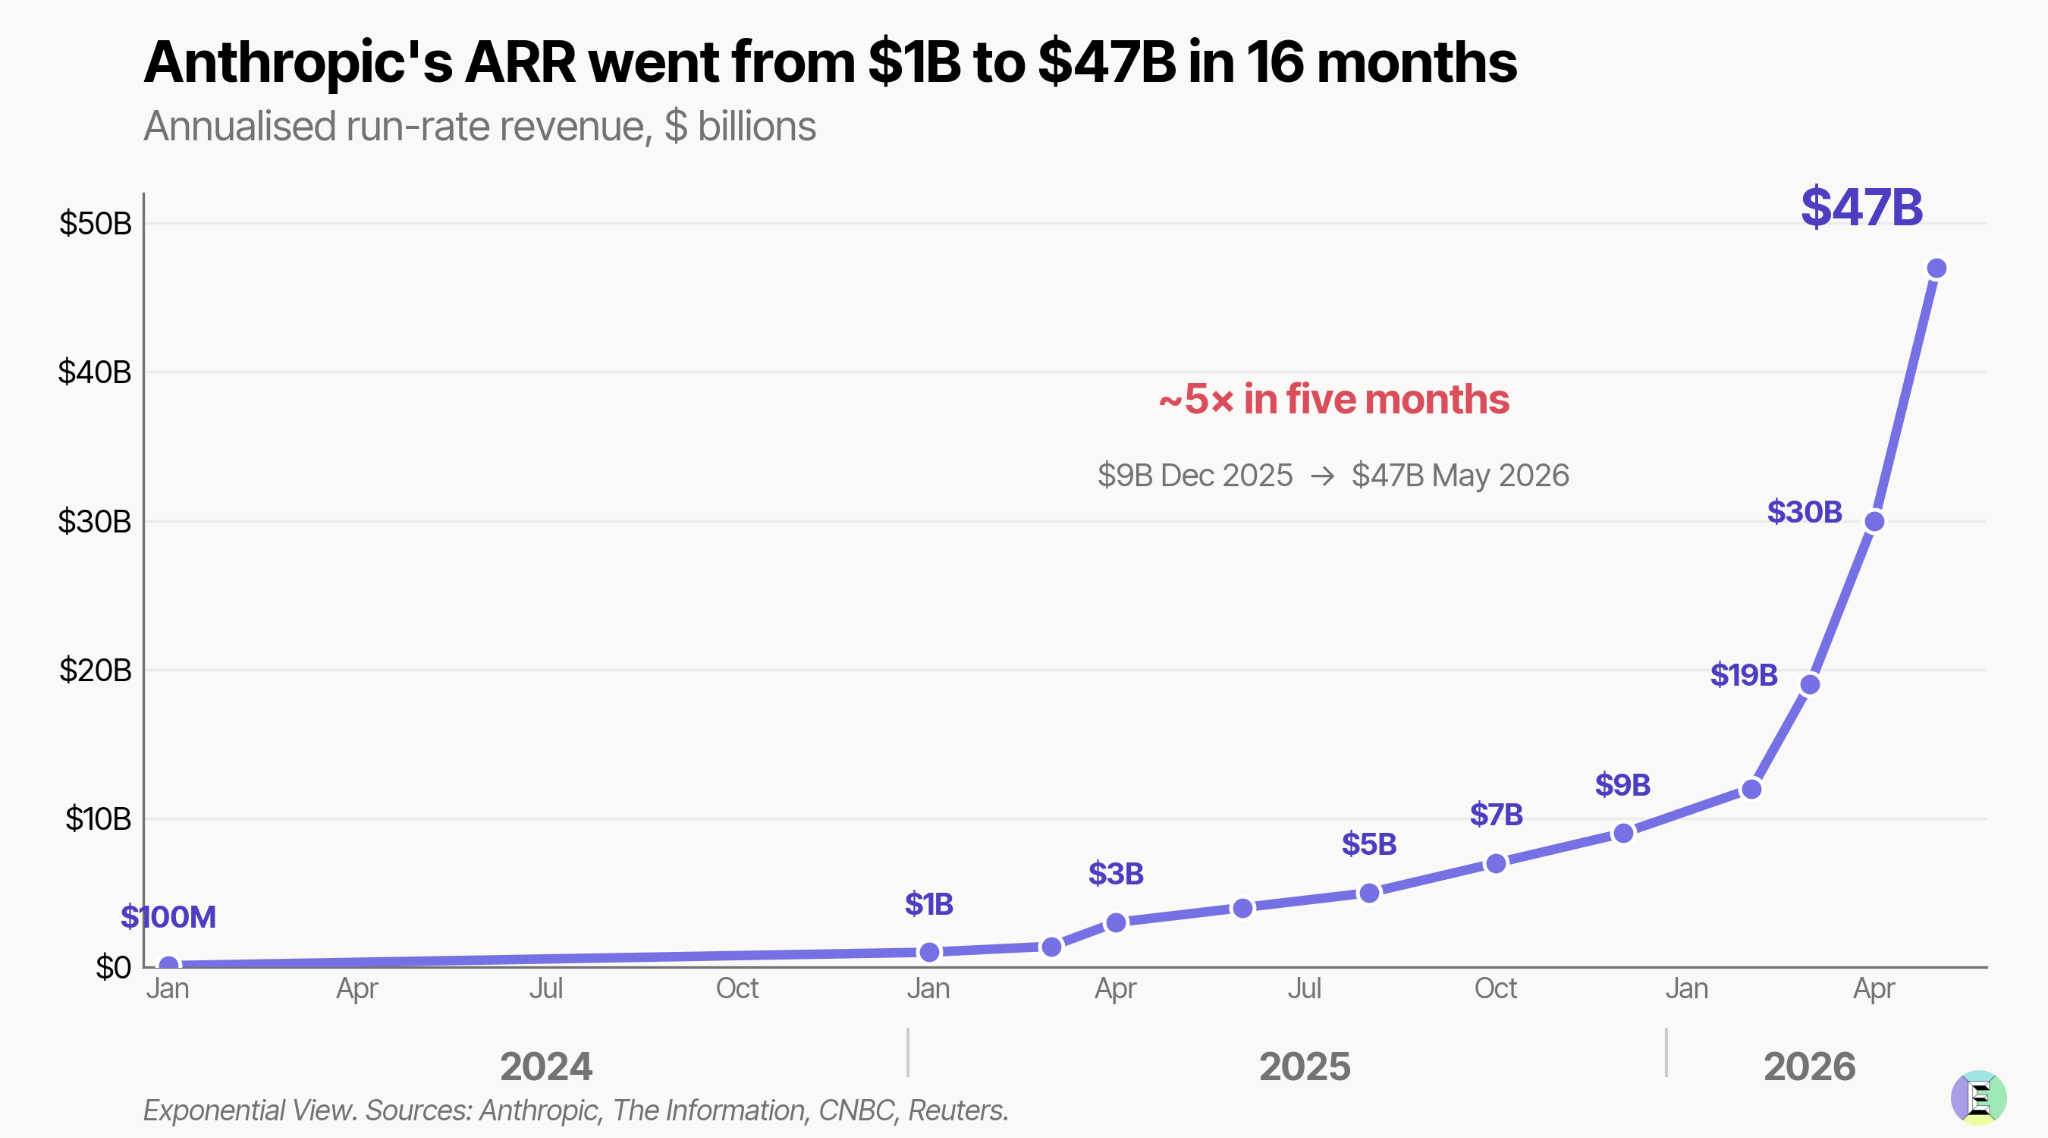
Revenue growth has actually accelerated, particularly by Anthropic at the turn of the year, surprising us, analysts, and even Dario Amodei.
“We tried to plan very well for a world of 10x growth per year. And yet we saw 80x. And so that is the reason we have had difficulties with compute.”
Rather than worsening as we expected, the indicator improved and is now well into the green, with revenue doubling every 0.73 years. Even if revenue growth for the rest of the year drops by 75 percentage points, this indicator would still sit in the green going into 2027.
