📊 EV’s Charts of the Week #86
Hi, I’m on holiday this week, so I asked EV member Nat Bullard to step in as a guest curator for Charts of the Week. Nat is one of the most astute observers of the energy transition and climate mitigation efforts; he’s also a keen visual analyst, so I couldn’t think of a better person to take care of this edition. Thank Nat by sharing his Charts of the Week on Twitter!
👋🏼
If you're new to Exponential View – hi! – you can sign up here for free.
Hi, it’s Nat Bullard. I’ve spent 15 years at the intersection of energy, technology and climate. I am a senior advisor to BloombergNEF, a weekly columnist for Bloomberg Green, and a venture partner at Voyager Ventures. Every day we have new indications of the structural changes happening within our energy/technology/climate system, and almost every day, I make charts to capture them. Here are a few that I think show where we are now, and hint at where we might be going.
Primary energy
Primary energy measures an economy’s consumption of energy before it has been transformed through combustion or a chemical process. Fossil fuel combustion is never that efficient - much of the primary energy is lost to heat - while renewable power, in particular, converts almost all of its energetic input into a useful output.
US primary energy consumption has been rangebound since 2004, even as population and economy have grown. Fossil fuel primary energy peaked in 2004; coal and oil both peaked in 2005 while gas use expanded markedly. That means all growth has been non-fossil, and most of that growth from wind and solar power.

Speed, change, abundance
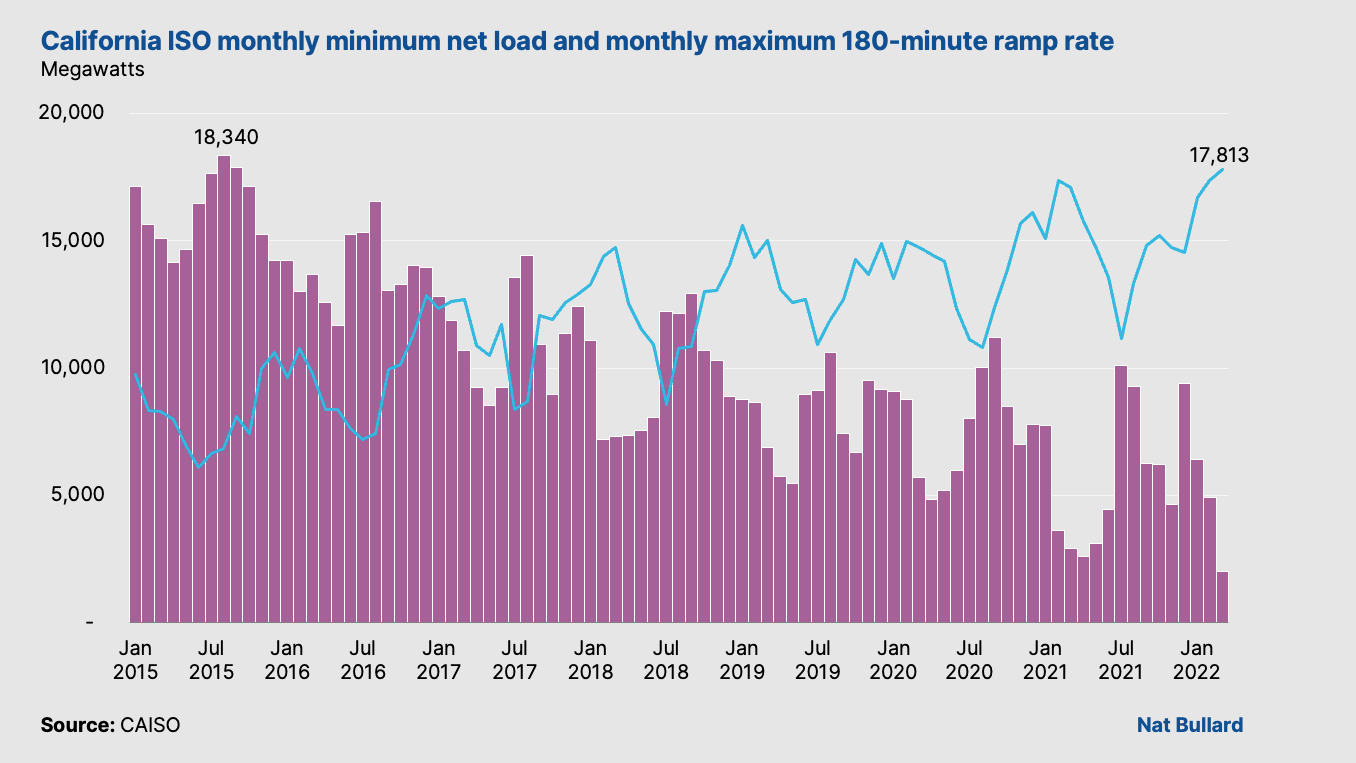
California’s electricity sector is on its way to 100% renewables (or hopefully, 100% zero-carbon if its remaining nuclear plant can be kept online and its fleet expanded). While other grids are straining with heatwaves (France and Texas, for example), California’s challenge so far this year is the amount of renewable power it must curtail. Curtailment is seasonal and it just keeps increasing.
At the same time, wind and solar in particular have depressed net demand that generation from gas, nuclear, hydro, and imports has come quite close to zero. This also means that the ramp rate – the amount of power that needs to be added in relatively short fashion to meet demand – has soared alongside renewable capacity.
Batteries are one way to meet this significant ramping requirement. California’s grid operator now estimates that batteries can meet more of summer peak demand than nuclear power. On July 15, batteries dispatched more power to the grid than nuclear power for a 25-minute period in the 7pm hour. Within a week, batteries would top nuclear three more times. California, like Australia, is a glimpse of the grid’s future; expect more batteries serving this role in big markets everywhere.
Regional balances
An important, albeit quiet, finding from the latest bp Statistical Review of World Energy is how much global demand for energy has shifted in the past three decades. Countries outside the OECD are now the drivers of demand growth. For some sources, they are also the driver of overall demand volume. OECD countries consume more gasoline than non-OECD countries, but the opposite is true for diesel. Jet fuel demand in both blocs was quite similar during the first year of the pandemic.
OECD gasoline demand has peaked, but with both Europe and China leading on electric vehicle deployment, it is worth watching the speed of OECD demand erosion, and the tapering of growth elsewhere.

A not-so-quiet finding: Asia absolutely dominates deployment of hydrogen electrolyzers. Electrolyzers are being built in every region (even the Americas, which have traditionally lagged) but in 2022, Asia will install twice as much as its own cumulative capacity through 2021, and 50% more than installed worldwide through last year.


