📊 EV's Charts of the Week #65
Hi, I’m Azeem Azhar. I convene Exponential View to help us understand how our societies and political economy will change under the force of rapidly accelerating technologies.
🙏🏻 In today’s Chart of the Week we feature charts curated by a dynamic research duo known as InfoDJs, Gary Price and Curtis Michelson.
🤩 This year we celebrate seven years of Exponential View. To celebrate with us, forward this newsletter to seven friends or colleagues.
DEPT OF WAR IMPACTS
There is a lot going on in this Russian war against Ukraine, but in Charts of the Week, I want to zero in on some financial and commodities indicators.
Rouble crypto trades
As sanctions bit, rouble-crypto trades increased as Russians started to use bitcoin as a safe haven. As of Feb 28th, the volumes are miniscule ($60m per day). Source: Financial Times
Not just gas
The Russian invasion of Ukraine puts vast parts of global food supply at risk. More than 70% of sunflower oil is produced in the two sovereign nations. Source: The Wall Street Journal
Egypt is most vulnerable
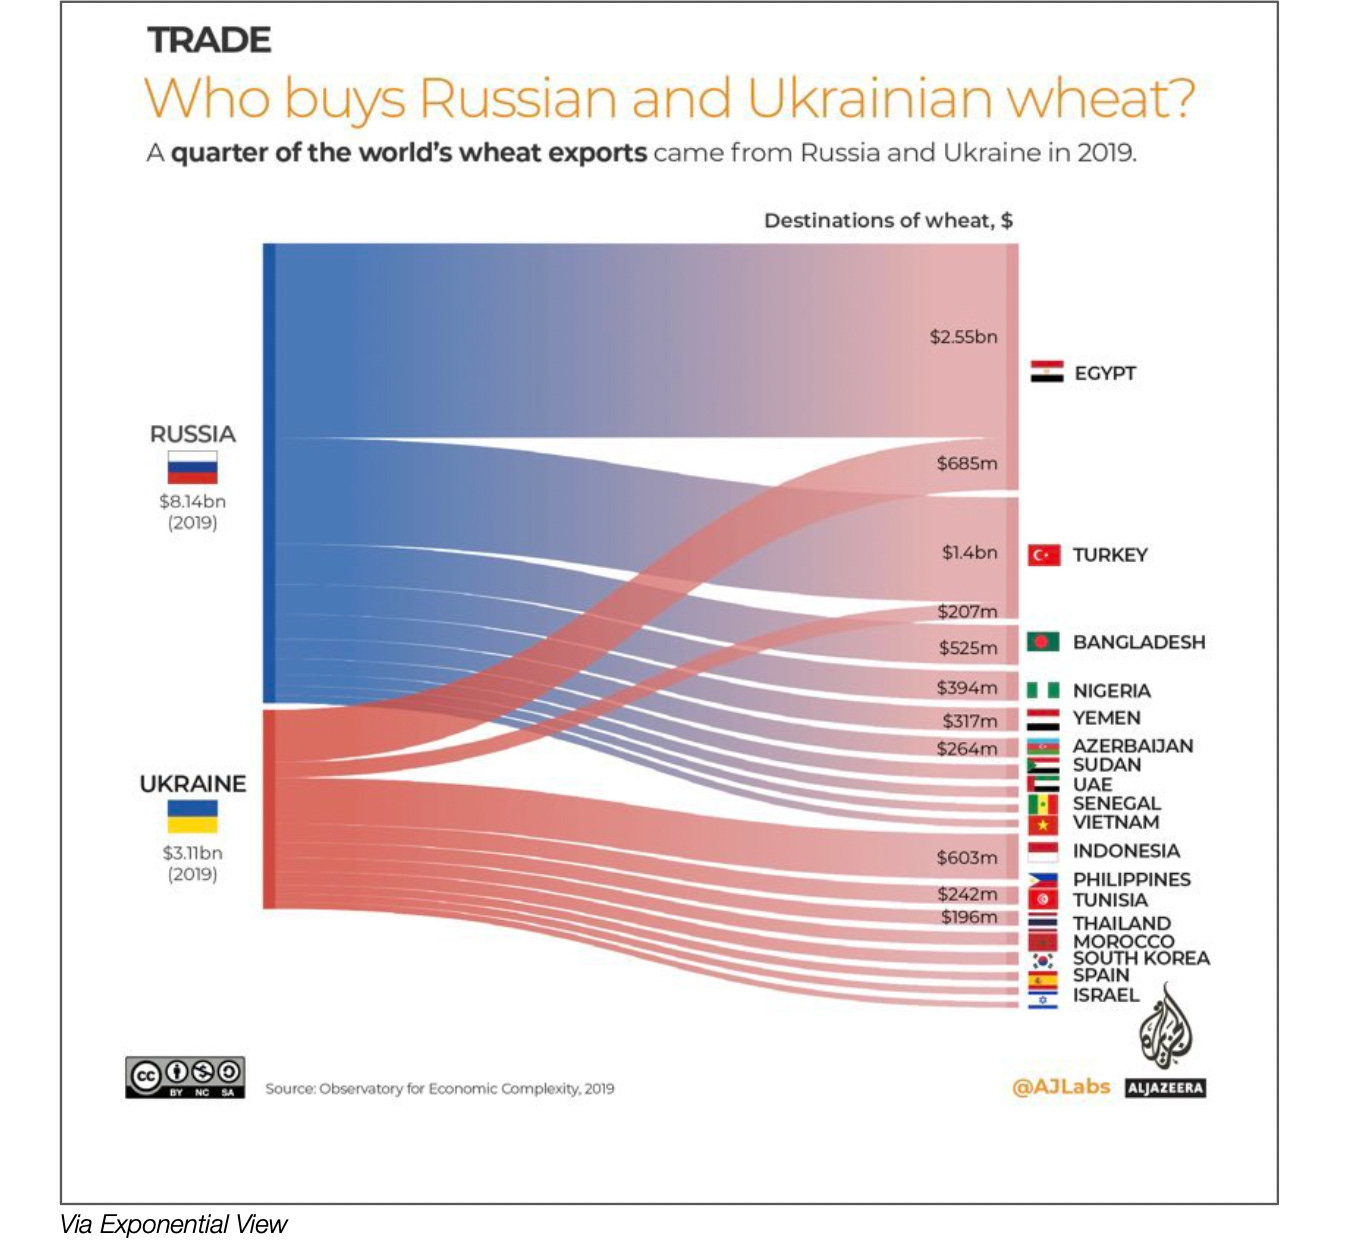
Asia and Africa are particularly reliant on Russian and Ukrainian wheat, especially Egypt. Source: The Observatory of Economic Complexity


