Exponential View by Azeem Azhar

Share this post

šŸ“Š EV’s Charts of the Week #46

www.exponentialview.co

šŸ“Š EV’s Charts of the Week #46

Azeem Azhar
Oct 6, 2021
Share this post

šŸ“Š EV’s Charts of the Week #46

www.exponentialview.co

Hi, I’m Azeem Azhar. I convene Exponential View to help us understand how our societies and political economy will change under the force of rapidly accelerating technologies. This is my member’s-only Charts of the Week mailout in which we explore the world through data.

DEPARTMENT OF CLIMATE

Prize-winning

The new Nobel Laureate, Klaus Hasselmann, created a model linking weather and climate. His methods have been used to prove that the increased temperature in the atmosphere is due to human emissions of carbon dioxide. Via Nobel Prize

You don’t want to be the winner

Twitter avatar for @DrSimEvans
Simon Evans @DrSimEvans
Super excited to finally share this updated analysis on the countries most responsible for climate change, now including all sources of CO2:

US 509GtCO2
CN 284
RU 172
BR 113
ID 103
DE 88
IN 86
UK 74
JP 68
CA 65

1/n
https://t.co/5PlQMZRhyR pic.twitter.com/z72TWakPVB
12:00 PM āˆ™ Oct 5, 2021

This week, I have prepared an expanded decarbonisation section. We are in the processing of revamping the decarbonisation section of the Sunday newsletter. I would love your thoughts in the comments about how you think it should look and what types of content we should curate there. For now, let’s jump in with this fantastic graphic of the leading carbon-emitting countries over the last hundred years or so. The top three historical emitters of CO2 are the US at 509Gt, China at 284Gt and Russia at 172. Brazil and Indonesia, with their aggressive deforestation, come higher than one might expect. (If the video doesn’t load up, click on the link.) Via Simon Evans

Carbon captured

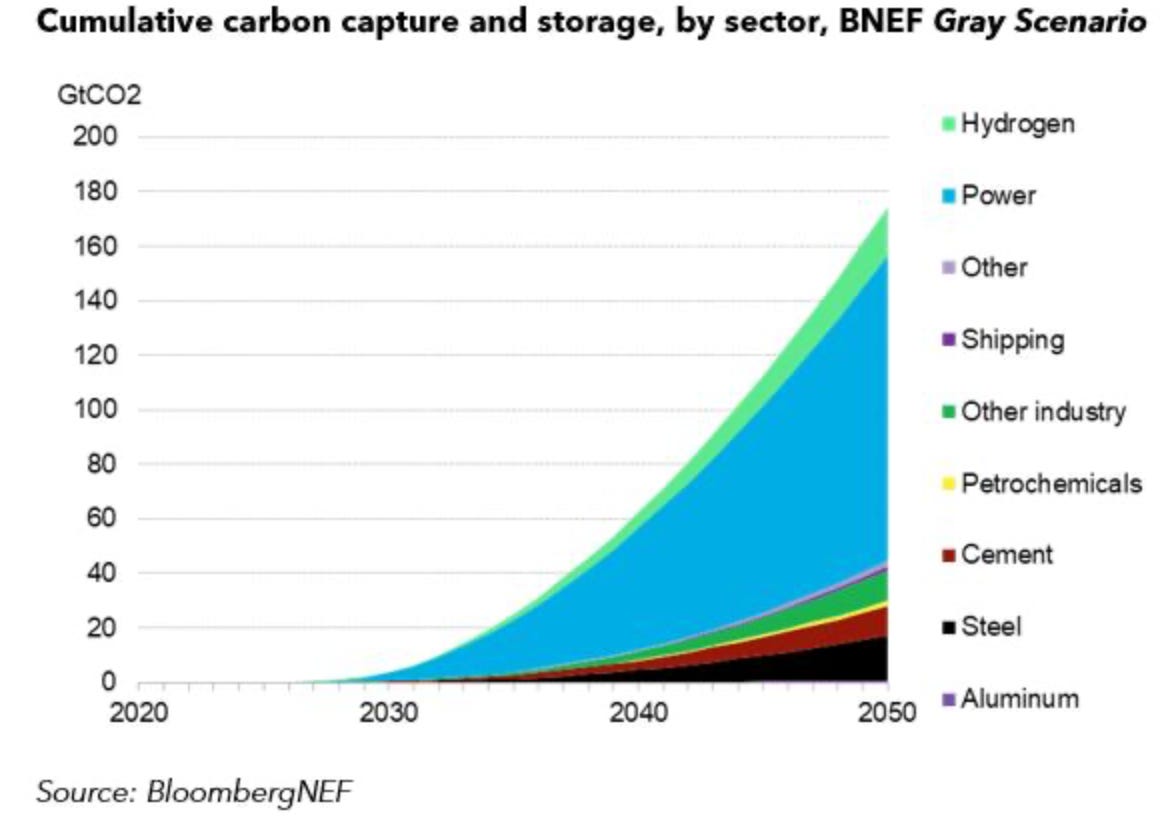
BloombergNEF put together a number of scenarios for decarbonisation. In their ā€œGray scenarioā€, they assume energy decarbonisation occurs at a moderate rate, forcing us into more aggressive carbon capture and storage (CCS) to achieve Net Zero. Were that scenario to hold, the task for the nascent CCS industry is an enormous one. (Fortunately, there are signs the power sector will decarbonise faster than that.) Via BloombergNEF

More energy, more storage

With more energy production comes more storage. Forecast for energy storage market size demonstrates the sharp rises forecast for renewable energy growth. Via Woodmac

Wind blows

If we dig deeper still, wind production is leading the way in power plant capacity additions in the US. Nearly 50 per cent of capacity added in Q2 2021 came from wing energy compared with less than 5 per cent from gas. Ā Via Renewable Energy World

Triple quarterpounder, no pickles

Regardless of advancements in renewable energy technology, we still have to look at how our behaviour influences the climate. This is remarkably clear in our diets. Compare CO2 emissions from beef production with air travel. It’s staggering. Via The Economist

Heat is transforming cities

Increasing numbers of people in cities are facing extreme heat over the last three decades. The number of person-days of extreme heat has quadrupled in that time. About a third of that is due to climatic warming and the heat island effect, population growth. Ā Via PNAS

DEPARTMENT OF POPULATION DECLINE

Drooping fertility

If you thought declining fertility rates were a problem only facing the West, you would have been mistaken. Via FT

China’s ongoing confusion over fertility

China has a long and convoluted relationship with fertility. The government is now trying to limit access to abortions, but as the chart shows, it’s not going to help much. Via The Economist

Who is going to pay the bills?

As fertility rates continue their downward slope, the working-age population percentages in G-7 countries is falling. We know how big a problem this is for Japan, but counties like Canada and Germany will face equally daunting challenges. Via Federal Reserve

Fewer marriages

It’s not just fertility; marriage rates are declining in the US. This is hitting lower earners the hardest. Via Scott Galloway

AND FINALLY

The next unicorn

Europe and the US are still leading the unicorn game but look at China and the rest of the world in 2010 compared with today. Dynamics are changing. Ā Via Matt Hartman

Big in Korea

5G is taking over South Korea. South Korean mobile data traffic reached 800 PB for the first time in August, and 56% of that traffic volume was 5G. Via tefficient

Endnote

If you are following the testimony by Frances Haugen, the Facebook whistleblower, you might find chapter eight of my book relevant. Ā I lay out a framework that explains how and why services like Facebook end up privatising public experience and what to do about it.

Azeem


How happy are you with today's Charts of the Week?

Unhappy | Meh | It's good | Great | Extremely happy, will forward

Share this post

šŸ“Š EV’s Charts of the Week #46

www.exponentialview.co
Previous
Next
Comments
TopNewCommunity

No posts

Ready for more?

Ā© 2023 EPIIPLUS1 Ltd
Privacy āˆ™ Terms āˆ™ Collection notice
Start WritingGet the app
SubstackĀ is the home for great writing